Charts, graphs, and tables are common features of textbooks, lecture notes, research papers, and study guides. They help explain complicated ideas, summarize large amounts of information, and show relationships that may be difficult to understand through text alone. However, simply looking at a visual representation of data is not the same as understanding what it means.
Learning how to interpret charts and graphs is an important academic skill. It helps students identify patterns, compare values, understand scientific results, and answer questions accurately in exams and assignments. The same skill is useful in subjects such as mathematics, biology, economics, geography, physics, and social sciences.
In this guide, you will learn how to read charts, graphs, and tables step by step, recognize common mistakes, evaluate the information presented, and use visual data more effectively when studying.
Why Is It Important to Interpret Charts, Graphs, and Tables?
Textbooks often use visual information to communicate ideas efficiently. A graph may show how a population changes over time, a table may compare experimental results, and a chart may summarize the distribution of a particular set of values.
Understanding these representations helps you:
- Understand complex information: Visuals can make relationships and patterns easier to recognize.
- Identify important trends: Graphs can reveal increases, decreases, fluctuations, and periods of stability.
- Compare information accurately: Tables and charts allow you to compare groups, categories, or measurements.
- Improve exam performance: Questions frequently ask students to describe trends, calculate differences, or draw conclusions from data.
- Strengthen critical thinking: Careful interpretation helps you recognize misleading scales, incomplete information, and unsupported conclusions.
- Remember key concepts: Connecting a visual representation with its meaning can make revision more active and purposeful.
The goal is not to memorize every number. Instead, you should understand what the data represents, what patterns it reveals, and what conclusions the evidence supports.
1. Start by Understanding the Title and Context
Before examining individual values, read the title and surrounding textbook text. These provide the context needed to interpret the visual correctly.
Ask yourself three questions:
- What topic is being discussed?
- What information does the chart, graph, or table present?
- What question is the visual intended to answer?
For example, a graph titled Average Monthly Rainfall in Three Cities tells you that the information concerns rainfall, compares three locations, and covers multiple months.
However, the title alone may not tell you whether rainfall is measured in millimeters or inches, whether the figures represent averages over one year or several decades, or whether the data is observed or estimated. You must check the labels and notes to understand those details.
Study tip: Read the paragraph immediately before or after the visual. Textbook authors often explain why the information matters or connect it to a concept introduced in the chapter.
2. Identify the Type of Visual Representation
Different types of charts, graphs, and tables are designed for different purposes. Recognizing the format helps you decide what to look for.
| Type | Main purpose | What to examine |
|---|---|---|
| Bar chart | Compare categories or groups | Differences in bar height or length |
| Line graph | Show changes across time or another ordered variable | Direction, trends, peaks, and fluctuations |
| Pie chart | Show parts of a whole | Proportions and percentages |
| Histogram | Show the distribution of numerical data | Frequency, concentration, and spread |
| Data table | Organize exact values | Row and column headings, units, and comparisons |
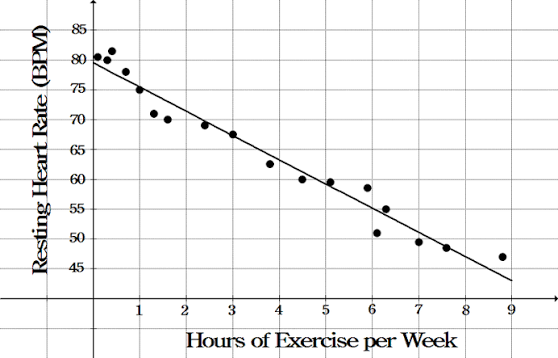
| Scatter plot | Show the relationship between two numerical variables | Association, clusters, and outliers |
| Diagram | Explain a structure or process | Labels, arrows, sequence, and connections |
For example, a bar chart comparing average exam scores across five classes is useful for identifying which class has the highest or lowest score. A line graph showing average scores over several months is more suitable for understanding how performance changes over time.
Choosing the right interpretation method begins with recognizing what the visual is designed to communicate.
3. How to Interpret Charts and Graphs Step by Step
When learning how to interpret charts and graphs, follow a consistent reading process rather than immediately jumping to conclusions.
Step 1: Read the title carefully
Determine the main subject and purpose of the visual. Rephrase the title in your own words to check your understanding.
Step 2: Examine the axes
In most standard graphs, the horizontal axis is called the x-axis, while the vertical axis is called the y-axis.
Check what each axis represents. One may show time, distance, temperature, or categories, while the other displays a measured quantity.
Never assume that the axes follow a familiar pattern. Always read their labels.
Step 3: Check the units and scale
Look for units such as kilograms, centimeters, degrees Celsius, percentages, or dollars.
Then examine the scale. Does it increase by 1, 5, 10, or 100 units? Does it start at zero, or does it begin at another value?
A scale that begins above zero can make small differences appear much larger than they are. Understanding the scale prevents you from misjudging the size of a change.
Step 4: Read the legend or key
If the graph contains several lines, colors, symbols, or patterns, use the legend to identify what each one represents.
For example, a line graph may use one line for boys and another for girls. Without checking the legend, you could easily assign the wrong meaning to a trend.
Step 5: Identify the overall pattern
Look at the visual as a whole before focusing on individual values.
Ask whether the data generally increases, decreases, remains stable, fluctuates, or shows differences between categories.
Step 6: Examine important details
After identifying the general pattern, look for the highest and lowest values, sudden changes, unusual observations, and important comparisons.
Use exact figures when the question requires them.
Step 7: Summarize the meaning
Explain the main finding in one or two sentences. Your summary should identify the pattern and support it with evidence from the visual.
For example:
The graph shows that average plant height increased throughout the four-week experiment, rising from 4 cm in the first week to 15 cm in the fourth week.
This is more informative than saying, “The graph goes up,” because it identifies the subject, the trend, and the relevant values.
4. How to Read a Bar Chart
Bar charts use rectangular bars to compare values across categories. The bars may be vertical or horizontal, depending on how the information is presented.
To interpret a bar chart:
- Read the category labels.
- Check what the numerical axis measures.
- Compare the heights or lengths of the bars.
- Identify the highest and lowest categories.
- Calculate differences if necessary.
- Consider whether the differences are meaningful in context.
Example: Comparing students’ preferred study methods
Suppose a textbook presents the following fictional survey results:
| Study method | Number of students |
|---|---|
| Reading notes | 18 |
| Practice questions | 30 |
| Group study | 12 |
| Video lessons | 24 |
The largest value is 30, so practice questions were the most commonly selected method. Group study had the smallest value, at 12 students.
The difference between practice questions and group study is:
30 − 12 = 18 students.
A useful interpretation would be:
Practice questions were selected by 18 more students than group study, making them the most popular option in this survey.
Notice that the conclusion is limited to the survey results. It does not prove that practice questions are the most effective method for every student.
5. How to Interpret a Line Graph
Line graphs are often used to show how a variable changes over time or across an ordered sequence. They are common in science, economics, geography, and mathematics.
When reading a line graph, examine:
- Direction: Is the line moving upward, downward, or remaining level?
- Rate of change: Does the value change gradually or rapidly?
- Peaks: Where does the variable reach its highest value?
- Troughs: Where does it reach its lowest value?
- Fluctuations: Does the line repeatedly rise and fall?
- Comparisons: If there are multiple lines, how do their patterns differ?
Example: Understanding plant growth
Imagine a line graph showing the height of a plant during a four-week experiment.
| Week | Plant height |
|---|---|
| 1 | 4 cm |
| 2 | 7 cm |
| 3 | 11 cm |
| 4 | 15 cm |
The plant grows throughout the observation period. Its height increases by 3 cm between weeks one and two, 4 cm between weeks two and three, and 4 cm between weeks three and four.
The total increase is:
15 − 4 = 11 cm.
A complete interpretation might be:
The plant’s height increased from 4 cm to 15 cm over four weeks, a total gain of 11 cm. Growth was greater in the second and third intervals than in the first interval.
The data shows the pattern of growth, but it does not establish what caused that growth. To explain the cause, you would need additional information about the experiment, such as watering, light exposure, temperature, and the presence of a comparison group.
6. How to Read a Pie Chart
A pie chart represents a whole divided into sections. Each section shows the proportion associated with a category.
Pie charts are often used for survey results, budget breakdowns, population composition, and other data that can be expressed as parts of a total.
When interpreting a pie chart:
- Identify what the entire circle represents.
- Read the category names.
- Check whether the sections are labeled with percentages, fractions, or values.
- Compare the sizes of the sections.
- Identify the largest and smallest proportions.
- Confirm that the categories and percentages make sense for the stated total.
If a pie chart represents 100% of a group, all its sections should add up to 100%, allowing for rounding.
Example: Time spent studying
Suppose a student divides a weekly study schedule as follows:
- Reading: 40%
- Practice questions: 30%
- Reviewing notes: 20%
- Group discussion: 10%
Reading accounts for the largest share of study time, while group discussion accounts for the smallest.
If the student spends 20 hours studying per week, reading takes:
40% × 20 = 8 hours.
The chart shows how the student’s time is distributed. It does not automatically show whether that schedule is effective or whether a different allocation would produce better results.
7. How to Interpret Tables in Textbooks
Tables present information in rows and columns. They are especially useful when readers need exact figures or must compare several variables at once.
Unlike graphs, tables often allow you to locate precise values without estimating from a scale.
Use the following approach:
Read the table title
Identify the subject, population, location, or period covered by the data.
Understand the row and column headings
Row headings usually identify categories or observations, while column headings describe the variables being compared. However, the structure may vary, so read both carefully.
Check units and footnotes
A table may report values in thousands, millions, percentages, or specific measurement units. Footnotes may explain abbreviations, missing values, rounding, or exceptions.
Locate the relevant values
If the question asks for one specific result, find the appropriate row and column and trace them to their intersection.
Compare values systematically
Compare values within the same category or across the same variable. Avoid comparing numbers that represent different units or different types of measurement.
Look for patterns and exceptions
Determine which values are largest or smallest, whether the numbers change consistently, and whether any observation differs noticeably from the others.
Example: Comparing examination results
Consider this fictional table:
| Subject | Class A average | Class B average |
|---|---|---|
| Mathematics | 76 | 82 |
| Biology | 84 | 79 |
| History | 72 | 75 |
The table shows that Class B has a higher average in mathematics and history, while Class A has a higher average in biology.
The difference in mathematics is:
82 − 76 = 6 points.
A suitable summary is:
Class B recorded a mathematics average six points higher than Class A, while Class A performed five points higher in biology. The results vary by subject rather than showing one class leading in every category.
This summary compares the values accurately without making a broader claim about overall academic ability.
8. How to Recognize Trends, Patterns, and Relationships
Identifying a pattern is one of the most important parts of interpreting visual data. A pattern describes how values behave across categories, measurements, or time.
Common patterns include:
- Increasing trend: Values generally rise.
- Decreasing trend: Values generally fall.
- Stable pattern: Values remain approximately the same.
- Fluctuating pattern: Values rise and fall.
- Positive association: Two variables tend to increase together.
- Negative association: One variable tends to decrease as the other increases.
- No clear association: The data does not show an obvious consistent relationship.
Be precise when describing patterns. A line may rise overall even if it contains a few downward movements. Similarly, two variables may have a positive association without one directly causing the other.
For example, a graph might show that students who spend more time practicing questions tend to achieve higher scores. This suggests an association, but the graph alone cannot prove that practice time is the only cause. Prior knowledge, study quality, and other factors may also affect results.
Important: Describe what the data demonstrates before explaining why the pattern might exist.
9. How to Compare Data Accurately
Textbook questions often ask you to compare groups, identify differences, or calculate percentage changes.
Use the method that matches the wording of the question.
Finding an absolute difference
Subtract the smaller value from the larger value.
For example, if one group scores 85 and another scores 70:
85 − 70 = 15 points.
Calculating percentage change
Use this formula:
Percentage change = ((New value − Original value) ÷ Original value) × 100
For example, if a measurement increases from 50 to 60:
((60 − 50) ÷ 50) × 100 = 20%
The measurement increased by 20%.
Distinguishing percentages from percentage points
Suppose a pass rate rises from 40% to 50%.
The increase is 10 percentage points. Relative to the original 40% rate, the increase is 25%.
These expressions are not interchangeable, so use the wording that accurately describes the calculation.
Comparing values on different scales
If two graphs use different units or scales, check whether their values can be compared directly. A difference of 10 degrees is not the same kind of quantity as a difference of 10 centimeters.
For exam questions, show the calculation when appropriate and include units in the final answer.
10. How to Interpret Graphs Critically and Avoid Misleading Conclusions
Not every chart communicates information clearly. Some visuals can create misleading impressions because of the way the data is selected, scaled, labeled, or presented.
Develop the habit of checking the following details.
A truncated vertical axis
A graph that begins at a value above zero may exaggerate apparent differences between groups. Read the axis carefully before judging the size of a difference.
Unequal intervals
Check whether intervals on an axis are consistent. Unequal intervals displayed as if they were equal can distort the apparent relationship between values.
Missing labels or units
Without labels and units, it may be impossible to determine what a number represents. Look for captions, footnotes, and explanatory text.
Selective data
A graph may display only part of a time period or omit relevant comparison groups. Ask whether the information shown is sufficient to support the stated conclusion.
Confusing correlation with causation
Two variables may change together without one causing the other. Additional evidence is needed to establish a causal relationship.
Small differences presented as major findings
A visual may make a small numerical difference look dramatic. Compare the actual values, the scale, the sample size, and the uncertainty where available.
Missing sample sizes or context
A percentage based on 20 observations may have a different level of reliability from the same percentage based on 20,000 observations. Consider the source, sample, date, and method of data collection when these details are provided.
A useful rule is to ask: Does the conclusion follow from the data, or does it go beyond what the visual can prove?
11. How to Use Charts and Graphs Effectively When Studying
Reading a graph once may help you understand the topic, but actively working with the information can make your study session more productive.
Use the cover-and-recall method
Study the chart, then cover it and explain the main finding from memory. Reopen it to check whether your explanation was accurate.
Write a one-sentence summary
For each important visual, write one sentence that captures its main message. Include a specific value or comparison when relevant.
Create questions from the data
Turn the visual into practice questions, such as:
- Which category has the highest value?
- How much did the measurement change?
- What trend is visible?
- Which two groups differ most?
- What conclusion is supported by the evidence?
- What additional information would help explain the pattern?
Connect the visual to the textbook explanation
Ask how the graph or table supports the chapter’s main concept. This helps you understand the reason the author included it.
Record important figures with their meaning
Instead of copying a list of numbers into your notes, record the most important values and what they demonstrate. For example, write, “The reaction rate increased as temperature rose within the tested range,” if that is what the data supports.
For more effective revision, combine this approach with . Replace the example link with the URL of a relevant study-skills article on your website.
12. How to Answer Exam Questions About Charts, Graphs, and Tables
When answering questions based on visual data, pay attention to the instruction word. Different verbs require different kinds of answers.
| Instruction word | What to do |
|---|---|
| Identify | Name the required value, category, or feature. |
| Describe | Explain the visible pattern or trend. |
| Compare | State similarities or differences using evidence. |
| Calculate | Perform the required mathematical operation and show working when needed. |
| Explain | Give a reason or mechanism supported by the available information. |
| Evaluate | Assess the evidence, limitations, and strength of the conclusion. |
| Predict | Suggest a likely outcome based on the observed pattern, while recognizing uncertainty. |
A simple structure for descriptive answers
A strong response often includes three parts:
- Main finding: State the overall pattern.
- Evidence: Include one or two relevant figures or comparisons.
- Interpretation: Explain what the pattern means in the context of the question.
For example:
The measured temperature increased during the first three hours, rising from 20°C to 35°C. It then remained close to 35°C during the final hour. This indicates that the temperature rose initially before stabilizing during the observation period.
Do not add an explanation of the cause unless the question provides enough evidence to support it.
13. Common Mistakes Students Make When Reading Visual Data
Even students who understand the subject can misinterpret visual information when they overlook small details.
Avoid these common errors:
- Ignoring the title: You may misunderstand the topic or time period.
- Skipping axis labels: You may assign the wrong meaning to the values.
- Forgetting units: A numerical answer without the correct unit may be incomplete.
- Reading only the highest value: The overall pattern may be more important than a single observation.
- Confusing a count with a percentage: These measurements represent different things.
- Treating an estimate as an exact value: Values read from a graph may be approximate.
- Assuming a trend proves causation: A relationship does not necessarily explain why something happened.
- Overgeneralizing: Results from a limited sample may not apply to every population.
- Ignoring footnotes: Important qualifications may appear below the visual.
- Describing without evidence: Support your answer with relevant figures whenever possible.
To improve, slow down and verify the title, labels, units, scale, and source before writing your conclusion.
14. A Quick Checklist for Interpreting Charts, Graphs, and Tables
Use this checklist whenever you encounter a visual in a textbook or assignment.
- I understand the title and context.
- I know what each axis, row, and column represents.
- I have checked the units and scale.
- I understand the legend, symbols, and abbreviations.
- I have identified the main trend or comparison.
- I have checked the highest and lowest values where relevant.
- I have verified calculations and included units.
- I have considered the source and limitations of the data.
- My conclusion is supported by the information shown.
- I can summarize the main message in my own words.
You do not need to write out every item for every graph. Use the checklist as a mental routine until the process becomes familiar.
Frequently Asked Questions
What is the easiest way to interpret charts and graphs?
Start with the title, then read the axis labels, units, scale, and legend. Identify the overall pattern, examine important values, and summarize what the data shows in your own words. This step-by-step method reduces the risk of misreading the information.
What is the difference between a chart and a graph?
The terms often overlap in everyday use. Generally, charts present information visually to make comparisons or relationships easier to understand, while graphs commonly display numerical relationships or changes in variables. Bar charts, line graphs, and scatter plots are examples of visual data representations.
How do you interpret a graph in a textbook?
Read the title and surrounding text, determine what the axes represent, check the units and scale, and identify the trend. Then support your interpretation with specific values or comparisons and explain what the pattern means in context.
How do you interpret a table correctly?
Read the table title, row and column headings, units, and footnotes. Locate the relevant values, compare like with like, and identify important patterns. Check whether the data source and time period affect the conclusion.
Why are charts and graphs important in education?
They help students understand numerical information, recognize relationships, compare results, and communicate findings. They are particularly useful when a large amount of information would be difficult to explain through text alone.
How can I improve my graph-reading skills?
Practice with different types of visuals, explain patterns aloud, calculate differences and percentages, and answer questions about the data. Review any mistakes by checking labels, scales, units, and the wording of the question.
How can I tell whether a graph is misleading?
Look for truncated axes, inconsistent intervals, missing labels, selective data, unclear sources, and conclusions that go beyond the evidence. Compare the actual values rather than relying only on the visual impression.
Conclusion
Learning how to interpret charts and graphs helps you become a more confident and independent student. By understanding titles, labels, scales, units, trends, and numerical comparisons, you can extract important information from textbooks without jumping to unsupported conclusions.
The most effective approach is simple: identify what the visual represents, examine the data carefully, recognize the main pattern, and explain your findings with evidence. Apply this process consistently when studying, completing assignments, and preparing for exams.
With regular practice, charts, graphs, and tables become more than collections of numbers. They become useful tools for understanding concepts, evaluating evidence, and making informed academic decisions.
Suggested further reading: The Open University’s free learning resources on provide additional explanations and examples for students.
Leave a Reply