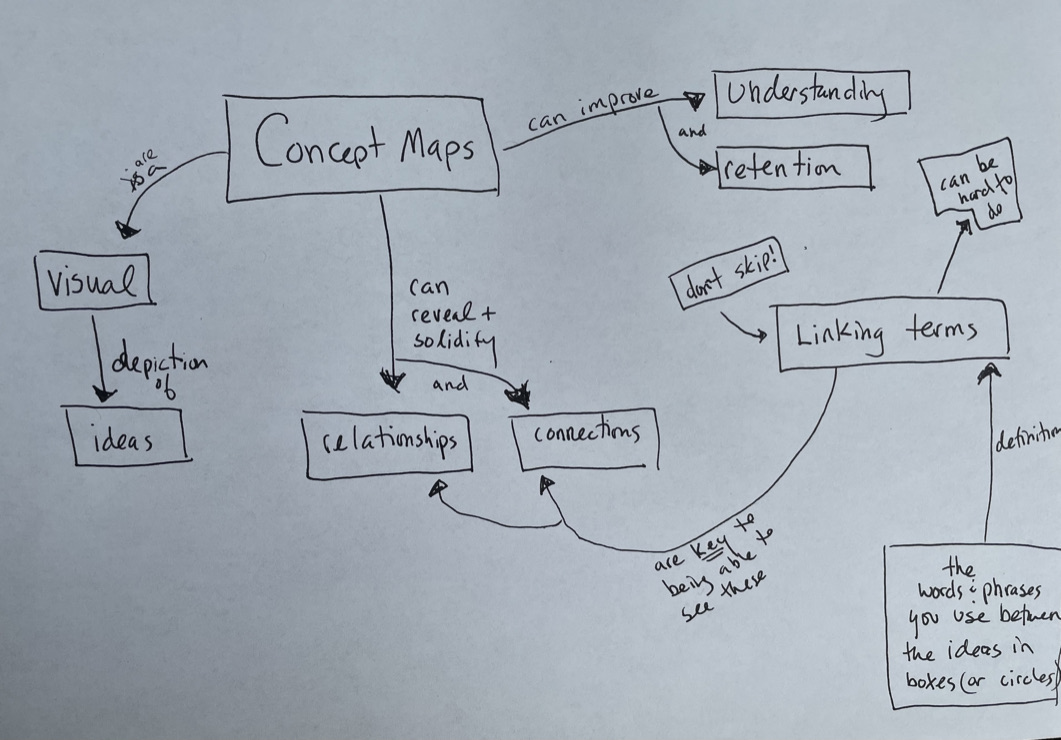
Understanding a complex subject can be challenging when a chapter contains dozens of unfamiliar terms, theories, processes, and related ideas. Reading the same notes repeatedly may help you recognize the information, but it does not always help you understand how the concepts fit together. A concept map offers a practical way to organize knowledge, identify connections, and see the bigger picture.
Learning how to create a concept map for studying can help you break complicated topics into manageable parts, connect new information with what you already know, and prepare more effectively for exams. Whether you are studying biology, mathematics, history, economics, psychology, or another subject, concept mapping can turn scattered notes into a structured visual representation of your knowledge.
In this guide, you will learn what a concept map is, how to create one step by step, which tools you can use, and how to use your finished map to improve understanding and revision.
What Is a Concept Map?
A concept map is a visual diagram that organizes important ideas and shows the relationships between them. It usually consists of concepts written inside boxes, circles, or other shapes, connected by lines or arrows. Short linking phrases explain how the concepts relate to one another.
Unlike a simple list of facts, a concept map shows how information fits together. It can illustrate relationships such as cause and effect, categories and examples, processes and outcomes, or similarities between different theories.
For example, a concept map about photosynthesis might connect sunlight, chlorophyll, carbon dioxide, water, glucose, and oxygen. The connections explain how these components relate to the process rather than presenting them as unrelated vocabulary words.
A useful concept map typically contains three elements:
- Concepts: The main ideas, terms, events, or processes you need to understand.
- Connections: Lines or arrows showing relationships between concepts.
- Linking phrases: Words that explain the relationship, such as “produces,” “depends on,” “includes,” or “leads to.”
Together, these elements help turn individual facts into a connected explanation.
Why Should Students Use Concept Maps for Studying?
Concept maps can be useful when a subject contains many related ideas or when understanding relationships is more important than memorizing isolated facts.
1. Break Complex Topics Into Smaller Parts
A large topic can feel overwhelming when all its information appears in long paragraphs or extensive notes. A concept map divides the subject into major themes and smaller supporting concepts.
For example, a chapter on the human nervous system could be organized into the central nervous system, peripheral nervous system, neurons, signals, and responses. Each branch can then contain more specific information.
2. Make Relationships Easier to Understand
Some subjects depend on understanding how one idea influences another. Concept maps can make these connections visible.
In economics, for instance, a map might connect supply, demand, prices, production costs, and consumer behavior. The connecting phrases help explain the relationships instead of simply listing economic terms.
3. Identify Gaps in Your Knowledge
Creating a map forces you to decide how ideas fit together. If you cannot explain the connection between two concepts, you may need to review the material.
This makes concept mapping useful for identifying misunderstandings before an examination.
4. Support Active Learning
Building a concept map requires you to select important information, organize it, and explain relationships. You are actively working with the material rather than simply copying it.
You can make the process more effective by creating a first draft from memory and then checking it against your notes or textbook.
5. Help With Exam Preparation
A well-organized concept map can provide a concise overview of a chapter or unit. It can help you review major ideas, explain processes aloud, and practice answering questions about relationships between concepts.
However, a concept map should support other study methods rather than replace practice questions, problem-solving, or detailed reading when those activities are needed.
Concept Map vs Mind Map: What Is the Difference?
Concept maps and mind maps are related visual learning tools, but they are not exactly the same.
| Feature | Concept Map | Mind Map |
|---|---|---|
| Main purpose | Explain relationships between concepts | Brainstorm and organize ideas around a central topic |
| Structure | Often hierarchical, with cross-connections | Usually radiates outward from a central idea |
| Connections | Often labeled with linking phrases | Commonly shown through branches and keywords |
| Organization | Emphasizes how concepts relate logically | Emphasizes associations and subtopics |
| Best used for | Understanding systems, theories, and complex relationships | Generating ideas, planning, and organizing initial thoughts |
For example, a mind map about environmental science might have branches for pollution, climate, ecosystems, and conservation.
A concept map would go further by showing relationships such as how greenhouse gas emissions contribute to climate change, how climate change affects ecosystems, and how conservation measures may reduce particular environmental pressures.
Neither tool is universally better. Choose the format that fits your learning goal. You can also brainstorm with a mind map first and convert it into a concept map once you understand the relationships more clearly.
How to Create a Concept Map for Studying: Step-by-Step Guide
You do not need expensive software or advanced design skills to make a useful concept map. Paper, a pencil, and your course notes are enough to get started.
Step 1: Choose a Specific Topic
Begin by deciding what you want your concept map to explain. Avoid starting with an entire subject if it contains too much information.
Instead of mapping all of biology, choose a focused topic such as cellular respiration, genetics, the immune system, or photosynthesis.
A useful topic should be broad enough to contain several connected concepts but narrow enough to organize on one page or screen.
Ask yourself:
- What chapter or topic am I trying to understand?
- What should I be able to explain after studying it?
- Which ideas are most important for my course or examination?
You can turn your goal into a focus question. For example, “How does cellular respiration release usable energy from glucose?” gives your map a clear purpose.
Step 2: Brainstorm the Main Concepts
Before drawing the map, create a list of the important concepts associated with your topic.
Review your textbook headings, lecture notes, assigned readings, diagrams, and learning objectives. Write down key terms, processes, causes, outcomes, and examples.
If you are studying photosynthesis, your list might include:
- Sunlight
- Chlorophyll
- Chloroplasts
- Carbon dioxide
- Water
- Light-dependent reactions
- Calvin cycle
- Glucose
- Oxygen
At this stage, focus on collecting relevant ideas rather than making the diagram look attractive.
You can also begin by writing everything you remember without looking at your notes. Afterward, check your materials to identify missing concepts and correct any misunderstandings.
Step 3: Identify the Main Concept
Choose the central idea that best represents the topic. This concept will anchor the rest of the map.
Depending on your preferred layout, place it at the top, in the center, or on the left side of the page.
For example, if you are mapping photosynthesis, place Photosynthesis in a prominent box or circle.
If your focus question concerns a process, you may want to organize the map in a sequence. If the topic involves categories, a hierarchy may be more suitable.
There is no single layout that works for every subject. The best arrangement is the one that makes the relationships easiest to understand.
Step 4: Group Related Concepts Into Categories
Next, organize the remaining terms into groups. This step helps you identify major branches and prevents the map from becoming a random collection of boxes.
For photosynthesis, you might create groups for:
- Requirements: sunlight, water, carbon dioxide, chlorophyll.
- Main stages: light-dependent reactions and the Calvin cycle.
- Products and outcomes: oxygen and sugar production.
- Location: chloroplast structures involved in the process.
These groups provide a starting framework. Check your course material to make sure the categories and relationships are scientifically accurate.
For a history topic, your categories might include causes, major events, important people, consequences, and long-term changes. For mathematics, they might include definitions, formulas, conditions, procedures, and examples.
Step 5: Arrange Concepts From General to Specific
Place the broadest concepts near the main topic and arrange more detailed ideas beneath or beside them.
A hierarchical structure makes it easier to move from an overview to specific details.
For example:
Cell Biology
- Cell structure
- Cell membrane
- Cytoplasm
- Nucleus
- Cell functions
- Energy production
- Protein synthesis
- Cell division
- Mitosis
- Meiosis
This hierarchy organizes the subject into meaningful levels. However, concepts do not always fit neatly into one branch. If two branches are connected, you can add a cross-connection rather than forcing the ideas into separate categories.
Step 6: Draw Lines or Arrows Between Related Concepts
Connect concepts that have a meaningful relationship. Use arrows when the direction of the relationship matters, such as in a process or cause-and-effect sequence.
The important point is that every connection should communicate something specific.
For example:
- Sunlight → provides energy for → photosynthesis
- Chlorophyll → absorbs → light energy
- Photosynthesis → produces → sugars
- Photosynthesis → releases → oxygen
These examples are simplified descriptions for learning purposes. Your map can include more detailed pathways when required by your course.
If a line connects two concepts but you cannot explain why the connection exists, review the material before keeping it.
Step 7: Add Linking Words to Explain Relationships
Linking phrases are one of the most important features of a concept map. They transform a collection of connected terms into meaningful statements.
Useful linking phrases include:
- consists of
- depends on
- causes
- contributes to
- includes
- produces
- is regulated by
- differs from
- is an example of
- influences
- requires
Consider the difference between these two connections:
- “Photosynthesis — glucose”
- “Photosynthesis — produces — glucose”
The second connection explains the relationship more clearly.
Try to make each connected sequence readable as a short sentence. This helps you check whether the map communicates an accurate idea.
Step 8: Add Cross-Connections Between Branches
A strong concept map can show relationships between ideas that appear in different branches.
For example, in a map about ecosystems, one branch might describe producers and consumers, while another explains energy flow. A cross-connection can show how producers introduce energy into food webs and how consumers obtain energy by feeding on other organisms.
Cross-connections are particularly useful for complex subjects because they reveal relationships that a simple outline might hide.
Do not add connections merely to make the diagram look complicated. Each cross-connection should represent a meaningful relationship that you can explain.
Step 9: Include Examples, Evidence, or Key Details
Add supporting information where it helps you understand the concepts. Depending on the subject, this might include examples, short definitions, equations, dates, experimental results, or exceptions to a rule.
For mathematics, you might include a worked example beside a formula. In history, you could add a date or event that illustrates a broader concept. In psychology, you might include an example of a theory applied to everyday behavior.
Keep these details brief. If the map becomes too crowded, create a separate map for a subtopic or move supporting explanations into accompanying notes.
Step 10: Review and Improve the Map
Your first concept map is a draft. Review it against your textbook, lecture notes, or other reliable learning materials.
Check the following:
- Is the main concept clearly defined?
- Are the most important ideas included?
- Are concepts grouped logically?
- Do the linking phrases accurately describe the relationships?
- Are the arrows pointing in the correct direction?
- Have you missed useful cross-connections?
- Are any ideas repeated unnecessarily?
- Is the diagram easy to read?
Correct factual errors and simplify confusing connections. If necessary, rearrange the concepts and create a second version.
The goal is not to produce a perfect-looking diagram on the first attempt. The goal is to create a map that accurately represents your understanding and helps you improve it.
Example of a Concept Map for a Complex Subject
Consider a student who wants to understand the relationship between the main ideas involved in photosynthesis.
A simplified concept map could be represented as follows:
<box border radius=”xl” padding={3} gap={2} align=”center”> <box background=”#E4F2E8″ theme=”light” radius=”lg” padding={3} width=”80%” align=”center”> <text weight=”medium” textAlign=”center”>Photosynthesis</text> </box> <text color=”secondary” size=”sm”>uses light energy to support</text> <row align=”center” gap={2} width=”100%”> <box background=”#E8F0FC” theme=”light” radius=”lg” padding={3} flex=”1″ align=”center”> <text weight=”medium” textAlign=”center”>Light-dependent reactions</text> </box> <box background=”#E8F0FC” theme=”light” radius=”lg” padding={3} flex=”1″ align=”center”> <text weight=”medium” textAlign=”center”>Calvin cycle</text> </box> </row> <row width=”100%” gap={2}> <box flex=”1″ align=”center” gap={1}> <text color=”secondary” size=”sm” textAlign=”center”>capture energy and form</text> <box border radius=”md” padding={2} width=”100%” align=”center”> <text textAlign=”center”>ATP and NADPH</text> </box> <text color=”secondary” size=”sm” textAlign=”center”>also releases oxygen</text> </box> <box flex=”1″ align=”center” gap={1}> <text color=”secondary” size=”sm” textAlign=”center”>uses carbon dioxide and energy carriers to support</text> <box border radius=”md” padding={2} width=”100%” align=”center”> <text textAlign=”center”>Sugar formation</text> </box> </box> </row> <text color=”secondary” size=”xs”>Simplified study example; the Calvin cycle produces G3P, which can be used to build glucose and other carbohydrates.</text> </box>
This example organizes the topic into a main process, two major stages, and their key functions. A more advanced biology map could include the thylakoid membrane, stroma, electron transport chain, carbon fixation, and the role of enzymes.
The appropriate level of detail depends on what your course expects you to understand.
How to Create Concept Maps for Different Subjects
Concept mapping can be adapted to different academic disciplines. The structure should reflect the kind of relationships that matter in the subject.
Biology and Other Sciences
Use concept maps to connect structures, functions, processes, causes, and outcomes.
For example, a map about the human circulatory system might link the heart, blood vessels, blood, oxygen transport, and body tissues. Arrows can show the direction of blood flow, while linking phrases explain the functions of each component.
For chemistry, a map might connect atomic structure, chemical bonding, molecular properties, and reaction behavior.
Mathematics
Mathematics concept maps can show how definitions, formulas, rules, and problem-solving methods relate.
A map about quadratic equations might connect the standard form, factorization, completing the square, the quadratic formula, and the discriminant.
Add a short worked example where necessary, and clearly state the conditions under which a formula or method applies.
History and Social Studies
History concept maps can organize causes, events, people, decisions, and consequences.
For example, a map about an important historical revolution could connect economic pressures, political conditions, social movements, key events, and long-term outcomes.
Use dates and specific examples to maintain historical accuracy. Avoid simplifying complex events into a single cause when several factors contributed.
Literature and Language
A literature concept map can connect characters, themes, conflicts, symbols, narrative structure, and historical context.
For language learning, you could link a word to its definition, synonyms, antonyms, common collocations, and example sentences.
These connections can help you understand how vocabulary functions in context rather than memorizing isolated definitions.
Economics and Business
Concept maps can show how variables and decisions influence one another.
For example, a map about supply and demand could connect consumer preferences, production costs, market prices, quantity supplied, and quantity demanded.
Use directional labels carefully, since relationships may depend on other conditions. A map should clarify the model you are studying rather than imply that every economic outcome has a single cause.
Should You Use Paper or Digital Tools?
You can create a concept map by hand or use digital tools. Both options can work well, and the right choice depends on your preferences and the complexity of the subject.
Creating a Concept Map on Paper
Paper is useful for brainstorming because you can quickly sketch ideas, move between concepts, and experiment with different layouts.
Advantages include:
- No software or internet connection is required.
- You can begin immediately.
- Drawing can be flexible and inexpensive.
- Paper maps are convenient for handwritten study notes.
The main limitation is that a large map can become difficult to rearrange. If the subject changes substantially, you may need to redraw part of the diagram.
Creating a Digital Concept Map
Digital mapping tools allow you to move concepts, edit labels, add links, and expand complex diagrams. Depending on the tool, you may also be able to collaborate with classmates or share your map with an instructor.
Possible options include:
- CmapTools for concept mapping.
- diagrams.net for creating diagrams and connected structures.
- Lucidchart for visual diagramming.
- XMind for mind maps and related visual organization.
Check each tool’s current features, pricing, and privacy settings before choosing one. You do not need specialized software to create a useful map; a basic drawing application or presentation tool may be enough.
How to Use a Concept Map to Study for Exams
Creating a concept map is only part of the process. To use it effectively, turn the finished diagram into a tool for recalling and explaining information.
1. Recreate the Map From Memory
After studying the original, close your notes and draw a new version from memory.
Include the main concepts, supporting details, and linking phrases. Compare the new map with the original to identify missing ideas and incorrect relationships.
This makes the map a retrieval-practice activity rather than just a reference sheet.
2. Explain the Connections Out Loud
Choose a branch and explain how each concept connects to the next. Try to describe the relationships without reading the labels directly.
If you cannot explain a connection, mark it for review and return to your course materials.
3. Turn Connections Into Questions
Convert the map’s relationships into questions.
For example:
- What role does chlorophyll play in photosynthesis?
- How do the products of light-dependent reactions support the Calvin cycle?
- Why is carbon dioxide needed for sugar production?
Answer these questions without looking at the map. This helps you test whether you understand the subject.
4. Use the Map Alongside Practice Problems
A concept map can show which formulas or ideas connect, but it cannot replace applying them.
In mathematics, solve problems using the relationships in your map. In biology, explain a process from beginning to end. In history, write a short explanation of how several causes contributed to an event.
5. Review the Map Over Time
Return to the map across multiple study sessions instead of reviewing it only once before the examination.
Try to reconstruct important sections from memory, answer questions, and revise any relationships you have misunderstood.
For more ideas on organizing your study routine, read our guide to effective study techniques for students.
Common Concept Mapping Mistakes to Avoid
A concept map can become less useful if it contains too much information or fails to explain the relationships between ideas.
Mistake 1: Copying Entire Paragraphs Into Boxes
Long explanations make the diagram difficult to scan and can hide the most important concepts.
Use concise labels and linking phrases. Keep detailed explanations in your notes or a separate reference document.
Mistake 2: Listing Ideas Without Showing Their Relationships
A collection of boxes connected by unlabeled lines may look organized but still leave the relationships unclear.
Add linking phrases that explain what each connection means.
Mistake 3: Including Too Many Details
Trying to include every fact from a chapter can create a crowded map.
Start with the main ideas and add details that help explain the structure. If necessary, create separate maps for related subtopics.
Mistake 4: Using Colors Without a Clear Purpose
Colors can help distinguish categories, but too many colors can make the diagram distracting.
Use a small, consistent color scheme to group related concepts or distinguish different types of information.
Mistake 5: Assuming That a Beautiful Map Means You Understand the Topic
A polished diagram does not guarantee accurate understanding.
Check the map against reliable course materials and test yourself by explaining or recreating it without looking.
Mistake 6: Never Revising the First Draft
Your understanding may change as you learn more. Update the map when you discover missing relationships, correct an error, or develop a clearer explanation.
Revision is part of the learning process, not a sign that the first attempt failed.
A Quick Checklist for Creating an Effective Concept Map
Before using your map for revision, check that it meets these criteria:
- The topic or focus question is clearly defined.
- The main concept is easy to identify.
- Major ideas are grouped logically.
- More specific details support the broader concepts.
- Lines and arrows show meaningful relationships.
- Linking phrases explain what each connection means.
- Important cross-connections are included.
- Examples or formulas are added where useful.
- The map is readable and not overcrowded.
- The information has been checked against reliable course materials.
- I can explain the main relationships without looking at my notes.
If several items are missing, revise the map before relying on it as your main study resource.
Frequently Asked Questions
What is the easiest way to create a concept map?
Start with a focused topic, list the key concepts, and place the main idea at the top or center of the page. Group related concepts, connect them with lines or arrows, and add short phrases that explain the relationships. Review and revise the map using your course materials.
What is the difference between a concept map and a mind map?
A concept map emphasizes explicit relationships between ideas, often using linking phrases and cross-connections. A mind map typically begins with a central topic and branches into related ideas. Both can be useful, but concept maps are particularly suitable when you need to explain how concepts connect.
How many concepts should a concept map include?
There is no fixed number. Include enough concepts to explain the topic’s important relationships without making the map difficult to read. A short revision map may contain a handful of major concepts, while a complex subject may need several connected maps.
Are concept maps useful for exam preparation?
Yes. Concept maps can help you organize information, recognize relationships, and identify gaps in understanding. They are especially useful when combined with retrieval practice, self-testing, and subject-specific exercises.
Can I create a concept map digitally?
Yes. You can use dedicated concept-mapping software, diagramming applications, presentation tools, or a digital whiteboard. Paper works equally well for many topics, so choose the format that makes it easiest for you to organize and revise ideas.
How is a concept map different from an outline?
An outline organizes information in a hierarchical list, usually with headings and subheadings. A concept map uses visual connections to show relationships between concepts, including connections across different branches. An outline may be easier for planning a written assignment, while a concept map can be more useful for exploring relationships.
Should I create a concept map before or after reading a chapter?
You can do both. Start with a rough map from memory before reading to identify what you already know and what you need to learn. Then revise it after reading and reviewing your notes. Comparing the two versions can help you identify how your understanding has developed.
Can concept maps help with research projects?
Yes. A concept map can help you organize a research topic, connect major themes, identify relationships between variables, and develop possible research questions. It can also help you organize evidence before writing a literature review.
Conclusion
Learning how to create a concept map for studying can make complex subjects easier to organize, understand, and review. By identifying the main concept, grouping related ideas, labeling connections, and adding meaningful cross-links, you can turn scattered information into a clearer picture of how a topic works.
The most useful concept map is not necessarily the most colorful or detailed. It is the one that accurately represents the subject and helps you explain the relationships between its key ideas.
Start with one chapter or difficult topic, build a simple first draft, and improve it as you learn. Then use the map to recall information, answer questions, and practice explaining concepts without looking at your notes. With regular practice, concept mapping can become a practical part of your study routine.
Leave a Reply