Finishing school or preparing for university can bring excitement, uncertainty, and pressure to make important decisions. Some students are ready to continue their education immediately, while others want time to explore career options, gain practical experience, or decide what they want from the future. A gap year can provide that opportunity when it is planned thoughtfully.
Understanding the gap year benefits and disadvantages can help you decide whether taking time away from formal education is the right choice. A gap year may involve working, volunteering, traveling, learning new skills, preparing for university, or exploring possible careers. It does not have to mean spending twelve months without a plan.
In this guide, you will learn what a gap year is, its main advantages and disadvantages, how to plan one, and how to make the experience useful for your education and career.
What Is a Gap Year?
A gap year is a planned period away from formal education or a traditional career path, often taken after high school and before starting university. Although the term suggests twelve months, a gap year can be shorter or longer depending on your circumstances and goals.
Students take gap years for different reasons. Some want to gain work experience, save money for tuition, travel, volunteer, prepare for entrance exams, or improve skills before beginning a degree. Others need extra time to consider their academic interests or prepare a stronger university application.
A successful gap year is not defined by how far you travel or how many activities you complete. It is defined by how well you use the time to meet personal, academic, or professional goals.
Benefits of Taking a Gap Year
There are several potential benefits to taking a gap year. The value you gain depends on your plans, resources, interests, and willingness to participate actively.
1. Discover Your Interests and Career Goals
Choosing a university degree can feel overwhelming, especially when you are unsure which subject suits you. A gap year can give you time to explore different fields before committing to a long-term academic path.
For example, volunteering at a community organization may help you understand whether social work interests you. A short internship in a business may give you a clearer idea of what working in marketing or management involves. Online courses, informational interviews, and personal projects can also help you explore possible careers.
These experiences cannot guarantee that you will find the perfect career, but they can help you make a more informed decision about your next step.
2. Gain Practical Work Experience
A job, internship, apprenticeship, or supervised placement can help you develop skills that are difficult to learn through classroom study alone. Depending on the role, you may improve communication, teamwork, time management, problem-solving, and professional responsibility.
Work experience can also help you understand workplace expectations, manage responsibilities, and build confidence in unfamiliar situations.
You do not necessarily need a prestigious internship to benefit. Part-time work in a shop, office, restaurant, tutoring service, or family business can teach valuable lessons when you approach the experience with clear goals.
Keep a record of your responsibilities, achievements, and skills. These details can later help you update your résumé, prepare a personal statement, or discuss your experience in a university interview.
3. Develop Independence and Confidence
A gap year may give you opportunities to make decisions, manage your schedule, and take greater responsibility for your progress. Working, volunteering, organizing a project, or managing a realistic budget can encourage independence.
You may also learn to handle challenges such as communicating with new people, solving practical problems, or adapting when plans change.
These experiences can be especially useful for students preparing to live away from home or manage the demands of university life. However, independence develops through practice rather than simply taking time off. Setting goals and accepting responsibility for your decisions are important parts of the process.
4. Learn New Skills
A gap year can be an opportunity to develop skills that support your future studies or career. You could learn a language, improve your writing, study basic coding, practice graphic design, complete an online course, or prepare for a professional certification.
Try to choose skills that connect with your interests or future plans. For example, a student considering computer science might build a small website, while someone interested in business could study spreadsheets, budgeting, or digital marketing.
You do not have to spend large amounts of money. Free learning resources, public libraries, community programs, and affordable courses may provide useful starting points. Before paying for a program, check its credibility, costs, and relevance to your goals.
5. Take a Break and Return With Renewed Motivation
After years of exams, assignments, and deadlines, some students feel mentally tired or uncertain about their next step. A planned break may give them space to rest, reflect, and regain motivation.
However, a gap year is not automatically a solution to stress or exhaustion. If you decide to take one, make room for rest while also maintaining a manageable routine. Consider talking to a trusted teacher, adviser, or qualified professional if ongoing difficulties are affecting your well-being.
6. Save Money for Future Education
Paid employment during a gap year may help you save toward tuition, books, accommodation, transport, or other university expenses. It can also help you develop budgeting habits before managing student finances.
Before relying on income from a job, research realistic wages, working hours, travel costs, and living expenses. If your main purpose is to save money, create a target and track how much you can realistically set aside each month.
Remember that some gap-year activities, especially international travel or organized programs, can be expensive. A gap year does not necessarily improve your financial position unless you plan the costs carefully.
Disadvantages and Challenges of a Gap Year
Although there are many potential advantages, understanding the gap year benefits and disadvantages also means considering the possible risks.
1. Losing Academic Momentum
After spending months away from school, you may find it difficult to return to regular study habits. Reading academic material, completing assignments, and preparing for exams may initially feel unfamiliar.
To reduce this risk, maintain a light learning routine during your break. Read regularly, practice relevant subjects, take a course, or work on a project connected to your intended degree. You do not need to study full-time, but keeping some academic habits can make the transition easier.
2. Delaying Graduation and Career Progress
Taking a gap year generally means beginning or completing your degree later than you otherwise would. This may also delay entry into certain graduate jobs or professions.
A later start is not automatically a disadvantage. Relevant experience or clearer career goals may make the time worthwhile. The important question is whether the benefits of the year justify the delay for your particular circumstances.
Consider your long-term plans, the length of your intended degree, and any professional or personal commitments before making a decision.
3. Facing Financial Pressure
Travel, accommodation, transport, insurance, training, and program fees can make a gap year costly. Even a year spent locally may involve expenses or reduced income if you are not working.
Prepare a realistic budget that includes essential costs, expected income, emergency funds, and unexpected expenses. If you are considering a paid program or travel organization, check its fees, refund policy, safety arrangements, and independent reviews before committing.
A lower-cost plan involving local work, volunteering, personal projects, or online learning may be more appropriate if your budget is limited.
4. Losing Structure and Motivation
Without classes, exams, or a regular timetable, it can be easy to postpone activities and let months pass without making progress. This is especially likely when you begin a gap year without clear goals.
Set a few achievable objectives and review them every month. You might aim to complete a course, save a specific amount, gain work experience, or prepare university applications by a certain date.
Build a routine that balances work, learning, rest, and personal interests. A plan should give you direction without making every day feel like another school timetable.
5. Feeling Left Behind by Friends
Some students feel uncomfortable when their friends begin university while they are working, volunteering, or staying at home. They may worry that they are falling behind or missing important social experiences.
Remember that people follow different educational and career timelines. A gap year is not a competition. Stay connected with friends, seek out communities related to your interests, and focus on whether your choices are helping you move toward your own goals.
What Can You Do During a Gap Year?
There is no single correct way to spend a gap year. Choose activities based on your budget, interests, responsibilities, and future plans.
Common options include:
Work part-time or full-time: Gain experience and save money for education.
Volunteer: Contribute to a community organization or cause you care about.
Complete an internship: Explore a profession and develop relevant workplace skills.
Take online courses: Build knowledge in a subject or skill you want to pursue.
Prepare for university applications: Research programs, study for required exams, and organize application materials.
Work on personal projects: Create a portfolio, develop an app, write, conduct independent research, or build something practical.
Travel thoughtfully: Experience different places and cultures if your finances and circumstances allow it.
Learn a language: Practice through structured lessons, conversation groups, or daily study.
You can combine several activities. For example, you might work for six months, save money, and then spend a few hours each week completing an online course related to your intended degree.
How to Plan a Successful Gap Year
Good planning can help you get more from your time off and reduce avoidable problems.
Step 1: Define Your Main Goal
Start by asking yourself why you want a gap year. Do you need work experience, time to explore career options, money for university, or a break before further study?
Write down one main goal and two or three supporting goals. Clear objectives make it easier to choose activities and assess your progress.
Step 2: Create a Realistic Budget
List your expected expenses, including transport, food, accommodation, course fees, equipment, insurance, and emergency savings. Estimate any income you expect from work or other sources.
If you plan to travel internationally, research visa requirements, health and safety guidance, insurance, and local costs before booking anything.
Step 3: Build a Flexible Schedule
Divide your gap year into manageable periods. For example, the first few months might focus on finding work, the next period on gaining experience or completing a course, and the final months on preparing for university.
Keep the schedule flexible enough to accommodate unexpected opportunities or changes in your circumstances.
Step 4: Check University and Scholarship Rules
If you already have a university offer, contact the admissions office before assuming you can defer admission. Deferral policies vary, and approval may not be automatic.
Ask whether taking a gap year affects scholarships, financial aid, accommodation, enrollment deposits, or application deadlines. If you have not yet applied, check how a year away will affect your application timeline and any required entrance exams.
Step 5: Track Your Progress
At the end of each month, review what you have done and what you have learned. Keep a simple record of completed projects, work responsibilities, courses, achievements, and challenges.
This record can help you identify progress, adjust your plans, and explain your gap year later in applications or interviews. Focus on the skills and lessons you gained rather than trying to make every experience sound impressive.
Is a Gap Year Right for You?
A gap year may suit you if you have a clear reason for taking one, a realistic financial plan, and activities that support your goals. It may be less suitable if you are postponing an important decision without knowing how you will use the time or if taking time off would create serious financial or academic difficulties.
Ask yourself these questions before deciding:
What do I hope to achieve during the gap year?
Can I afford the plan I have in mind?
How will I maintain a routine and stay motivated?
Will the year help me prepare for my intended course or career?
Have I checked university admission, deferral, and scholarship rules?
What is my plan for returning to study or moving into employment?
If you are uncertain, discuss your options with a school counselor, teacher, career adviser, or trusted family member. You can also consider shorter alternatives, such as a summer internship, part-time work, a short course, or volunteering alongside your studies.
Frequently Asked Questions
Is taking a gap year a good idea?
A gap year can be useful if it supports your goals and is planned realistically. It may offer work experience, time for reflection, new skills, and a chance to save money. However, the decision depends on your finances, motivation, academic plans, and personal circumstances.
Will a gap year affect my university application?
It depends on the institution and program. Some universities allow students to defer an offer, while others have specific conditions or restrictions. Contact the admissions office and confirm the policy before making commitments.
Can I take a gap year without traveling abroad?
Yes. You can spend your gap year working locally, volunteering, learning online, preparing for entrance exams, completing personal projects, or exploring career options. International travel is not required for a productive gap year.
How can I explain a gap year to universities or employers?
Be honest about why you took the break, what you did, and what you learned. Highlight relevant skills, responsibilities, projects, and experiences, and explain how they connect to your next step.
What if I do not have enough money for a gap year?
Consider lower-cost activities such as local employment, volunteering, free online learning, community projects, or living at home while saving money. Create a budget before committing to expenses, and avoid taking on debt for activities that are not essential to your goals.
Conclusion
A gap year can be a valuable opportunity to gain experience, explore your interests, build practical skills, save money, and prepare for your next stage of education. However, it can also bring financial pressure, a loss of academic routine, delayed graduation, and uncertainty if you do not have a plan.
The best decision depends on your goals and circumstances. Consider the gap year benefits and disadvantages carefully, research your options, and create a realistic plan before committing. Whether you choose to work, volunteer, study, travel, or combine several activities, make the year purposeful and review your progress along the way.
A successful gap year is not about doing the most activities or having the most impressive experiences. It is about using your time intentionally and moving toward your next step with greater clarity and confidence.
An academic recommendation letter can play an important role in your application for university admission, scholarships, internships, research opportunities, and graduate programs. It gives an admissions committee a perspective on your abilities that grades and test scores alone may not fully show. A thoughtful recommendation can highlight your academic strengths, work ethic, intellectual curiosity, and potential for future success.
However, getting a strong letter requires more than simply asking a teacher or professor to write one. You need to choose the right person, make your request professionally, provide enough time, and share the information they need to describe your strengths accurately.
If you are wondering how to request an academic recommendation letter, this guide explains each step, including when to ask, what documents to prepare, how to write a request email, and what to do after your recommender agrees.
What Is an Academic Recommendation Letter?
An academic recommendation letter is a written assessment from a teacher, professor, academic adviser, research supervisor, or another qualified person who knows your academic work. It describes your skills, achievements, personal qualities, and suitability for a particular opportunity.
Universities may use recommendation letters to understand how students participate in class, approach difficult assignments, conduct research, respond to feedback, or contribute to a learning community. Scholarship committees and research programs may also use them to assess motivation, reliability, and potential.
The best letters usually include specific examples rather than general praise. For instance, a professor might describe how you improved a research paper after receiving feedback or demonstrated strong analytical skills during a challenging project.
1. Choose the Right Person to Ask
Your first step is to identify someone who can speak meaningfully about your academic abilities and character. This could be a teacher whose class you attended, a professor who supervised your research, or an academic adviser familiar with your progress.
Choose your recommender based on how well they know your work, not simply their job title or reputation. Someone who can describe your achievements in detail may provide a more useful recommendation than a well-known academic who barely remembers you.
Before deciding, consider these questions:
Have I taken a course with this person or worked with them on a project?
Can they describe my strengths using specific examples?
Is their subject or professional experience relevant to my application?
Have they seen my effort, progress, or contribution over time?
Always check the application instructions before choosing a recommender. Some institutions require letters from specific teachers, academic staff, or research supervisors. Others permit professional references for certain opportunities.
2. Ask Well Before the Deadline
One of the most important rules for requesting an academic recommendation letter is to give the writer enough time. Teachers and professors may be managing classes, research, meetings, and other recommendation requests.
As a practical guideline, ask at least four to six weeks before the deadline whenever possible. For competitive scholarships, graduate applications, or periods when faculty members are particularly busy, asking even earlier is wise. Some universities recommend giving recommenders several weeks or more to prepare a detailed letter.
Do not wait until your application is nearly complete to contact your recommender. Start as soon as you know you will need a letter and have identified the relevant application requirements.
When you make the request, provide the exact deadline and explain whether the letter must be uploaded to an online portal, emailed directly, or submitted in another format. If you are applying to several programs, list all the deadlines clearly.
3. Make Your Request Politely and Professionally
You can ask in person, arrange a short meeting, or send a professional email. The best approach depends on your relationship with the person, their availability, and your institution’s usual practices.
If you regularly meet your professor during office hours, a brief conversation can be a comfortable way to begin. If you have graduated, study remotely, or cannot meet in person, email is entirely appropriate in many situations.
Your request should explain four things:
Who you are and how the recommender knows you.
What you are applying for and why you need the letter.
Why you are asking this particular person.
When the letter is due and how it must be submitted.
Ask whether the person would feel comfortable writing a strong recommendation for you. This gives them an opportunity to decline if they do not know your work well enough or cannot provide the support you need.
Be respectful and direct. Avoid pressuring the person or implying that they are obligated to help.
4. Provide the Information Your Recommender Needs
Once your recommender agrees, make their task as straightforward as possible. A letter is easier to personalize when the writer has accurate information about your goals, achievements, and application requirements.
Prepare a concise folder or document containing the following materials, as relevant:
Updated résumé or CV: Include your education, relevant experience, projects, activities, and achievements.
Academic transcript: Share your grades or academic record if requested or helpful.
Personal statement: Include a draft of your application essay or a brief explanation of your academic goals.
Program information: Provide the names of the universities, scholarships, internships, or research opportunities.
Deadline list: Clearly state each due date and submission method.
Examples of your work: Include a paper, project, research summary, or assignment that the recommender may remember.
You can also include a short paragraph explaining why you chose the program and what you hope to achieve. These materials should help the recommender write an accurate letter in their own words, not dictate what they must say.
5. Write a Clear Recommendation Request Email
A professional email should be polite, concise, and easy to understand. Use an informative subject line, address the person correctly, and make your request near the beginning.
Here is a template you can adapt to your situation.
Subject: Request for an Academic Recommendation Letter
Dear Professor [Last Name],
I hope you are doing well. My name is [Your Name], and I was a student in your [Course Name] class during [Semester or Year]. I particularly appreciated learning about [specific topic or experience], which strengthened my interest in [subject or academic field].
I am applying for [name of university program, scholarship, internship, or opportunity], and the application requires an academic recommendation letter. Since I learned a great deal in your class and believe you are familiar with my academic work, I wanted to ask whether you would feel comfortable writing a strong recommendation for me.
The submission deadline is [Date], and the letter must be submitted through [submission method]. I would be happy to provide my résumé, transcript, personal statement, and any other information that might be useful.
Thank you for considering my request. I understand that you have a busy schedule, and I appreciate your time.
Kind regards, [Your Full Name] [Your Department or Program] [Your Contact Information]
Before sending the email, replace every placeholder with accurate details. If possible, mention a specific assignment, project, or interaction that helps the professor remember your work.
6. Make the Submission Process Easy
After your recommender accepts, send the relevant instructions in one organized message. Confirm the deadline, submission link, required format, and any additional steps they need to complete.
If the application system sends an automated invitation, verify that you entered the correct email address. Let your recommender know to expect the message and check whether it reaches them.
For applications to multiple universities, create a simple table with each institution, program, deadline, and submission method. This reduces confusion and makes it easier to track progress.
Remember that some institutions require the recommender to submit the letter directly. Follow the official instructions and do not upload or send a letter yourself unless the application explicitly allows it.
7. Send a Polite Reminder and Express Gratitude
Even if your recommender has agreed to help, a brief reminder before the deadline may be useful. Send it politely, preferably about one to two weeks before the due date, unless your recommender has suggested another timeline.
For example:
“Dear Professor [Last Name], I hope you are doing well. I wanted to send a gentle reminder that the recommendation letter for [program name] is due on [date]. Please let me know if you need any additional information from me. Thank you again for your time and support.”
Avoid sending repeated messages in a short period or making your recommender feel pressured. If the deadline is approaching and the letter has not been submitted, follow up respectfully and check whether there is anything you can do to help.
After the letter has been submitted, send a thank-you email. If you later receive an admission decision, scholarship, or other outcome, consider updating the recommender. This is a courteous way to recognize their contribution and maintain a positive academic relationship.
Common Mistakes to Avoid
When requesting an academic recommendation letter, avoid these common errors:
Asking too late: Last-minute requests can limit the writer’s time and may be declined.
Choosing someone who barely knows you: A detailed, personal letter is often more useful than a generic one.
Providing incomplete information: Missing deadlines, links, or program details can create unnecessary work.
Sending an overly casual email: Use a respectful greeting, professional language, and a clear subject line.
Demanding specific praise: Share helpful context, but allow the recommender to make an independent and honest assessment.
Forgetting to follow up: Track the submission status and send a courteous reminder when appropriate.
Failing to say thank you: Recognize the time and effort involved, even if the outcome of your application is uncertain.
Frequently Asked Questions
How early should I request an academic recommendation letter?
Try to ask at least four to six weeks before the deadline. Earlier is better for competitive programs, scholarships, or applications requiring multiple letters. Always check whether your institution provides a specific timeline.
Who is the best person to write an academic recommendation letter?
Choose a teacher, professor, research supervisor, or academic adviser who knows your work and can describe your relevant strengths. Follow the institution’s requirements because some applications specify who may write the letter.
Is it acceptable to request a recommendation letter by email?
Yes. A professional email is a common way to make the request, particularly when you have graduated or cannot meet in person. If you already have a close academic relationship, you can also ask during office hours or arrange a meeting.
What should I attach to my request?
Useful materials may include your résumé, transcript, personal statement, program details, relevant assignments, and a list of deadlines. Provide only what is relevant and follow any instructions from your recommender.
What if a professor declines my request?
Thank them for considering it and ask someone else who can speak confidently about your academic abilities. A respectful refusal may mean the professor lacks time or does not feel able to write a sufficiently detailed letter. Do not pressure them to reconsider.
Conclusion
Learning how to request an academic recommendation letter is an important part of preparing a successful university or scholarship application. The process becomes much easier when you choose someone who knows your work, ask well in advance, explain your goals, and provide clear submission instructions.
A thoughtful request shows respect for your recommender’s time and helps them write a more relevant and accurate letter. Start early, communicate professionally, follow up politely, and remember to express your gratitude. These simple habits can help you build stronger academic relationships while preparing for your next educational opportunity.
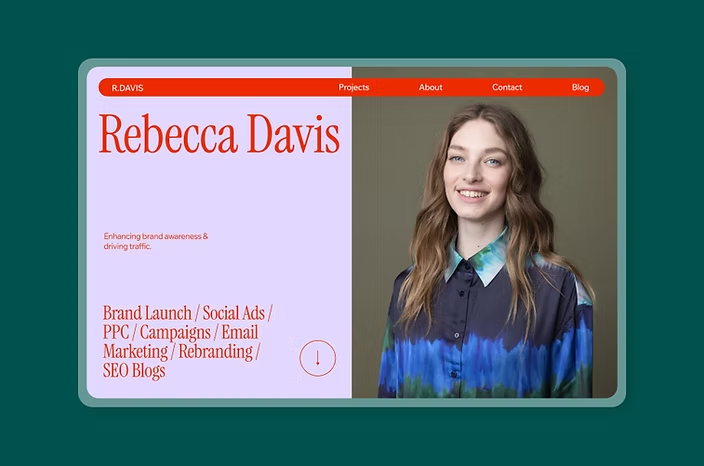
Applying to university is an important step toward your academic and professional future. While grades, recommendation letters, and personal statements are important parts of many applications, some universities also ask students to submit a portfolio. A well-prepared student portfolio for university applications can help admissions teams understand your skills, interests, creativity, and potential beyond your academic results.
A portfolio is more than a collection of completed projects. It is an organized presentation of your work, achievements, learning experiences, and personal development. Depending on your chosen subject, it might include artwork, writing samples, research projects, coding projects, photography, presentations, or evidence of extracurricular activities.
The key is to create a portfolio that matches your intended course and shows what makes you a suitable candidate. This guide explains how to plan, organize, and improve your portfolio before submitting your university application.
What Is a Student Portfolio for University Applications?
A student portfolio is a carefully selected collection of work that demonstrates your abilities, interests, and progress. Universities may request portfolios for creative courses such as art, design, architecture, film, and photography. Some academic programs may also accept portfolios containing research, writing, technical projects, or other evidence of relevant experience.
The exact purpose depends on the institution and program. A creative portfolio might demonstrate artistic skills and the development of ideas, while a computer science portfolio could showcase software projects, coding examples, or technical problem-solving.
A strong portfolio should help admissions staff answer three questions:
What can this student do?
How does this student approach challenges and develop ideas?
Why is this student’s experience relevant to the chosen course?
Before creating anything, check the university’s official application instructions. Requirements may specify the number of items, file format, page limit, submission platform, or types of work accepted.
1. Understand the University’s Portfolio Requirements
The first step is to research the requirements of every university and course you are applying to. Do not assume that one portfolio will meet every institution’s expectations.
Visit the official course and admissions pages. Look for information about accepted materials, submission deadlines, file size, and whether the university expects finished work, drafts, reflections, or a combination of these.
Create a simple checklist for each application. For example, one university may ask for a PDF with selected projects, while another may require images uploaded individually with descriptions. A design course may want to see your creative process, whereas another program may focus on finished work.
If instructions are unclear, contact the admissions office before submitting. Following the stated requirements is more useful than adding extra material that the university did not request.
2. Choose Work That Matches Your Intended Course
Your portfolio should demonstrate your readiness and interest in the subject you want to study. Select examples that are relevant to the course rather than including everything you have ever created.
For an art or design application, you might include original drawings, paintings, design experiments, photography, models, or digital artwork. For a writing-focused program, suitable examples could include essays, short stories, articles, or research-based writing. A technology-related portfolio might feature a website, an app, a programming project, or a technical presentation.
Choose work that demonstrates different strengths while maintaining a clear connection to your academic goals. Quality is generally more persuasive than quantity, so avoid including weak or unrelated projects simply to make your portfolio longer.
If you have limited experience, do not worry. School assignments, independent projects, personal experiments, and relevant extracurricular activities can all be useful when the university permits them. Focus on what you learned and how the work demonstrates your potential.
3. Show Your Creative or Problem-Solving Process
A strong portfolio often explains not only the final result but also how you reached it. Depending on the course requirements, include relevant sketches, early drafts, research notes, prototypes, planning documents, or progress photographs.
These materials can show how you explored an idea, considered alternatives, responded to feedback, and improved your work. They may also demonstrate your ability to learn from mistakes and make thoughtful decisions.
For example, if you designed a poster for a school event, you could show an early layout, two alternative designs, and the final version. A short caption could explain why you selected particular colors, fonts, or images for the intended audience.
However, process materials are not compulsory for every application. Some programs specifically request finished work only. Always follow the instructions for your chosen course rather than applying one portfolio style to every university.
4. Organize Your Portfolio in a Clear Structure
Good organization makes it easier for admissions staff to understand your work. Arrange your portfolio in a logical order, using a consistent layout and readable text.
A practical structure may include:
Cover page: Your name and the portfolio title, if permitted.
Brief introduction: Your academic interests and intended course.
Selected projects: Your strongest and most relevant work.
Project descriptions: Titles, dates, tools or materials, and your role.
Process evidence: Drafts or development stages, when requested.
Closing section: A brief reflection or summary, if the format allows it.
Start with a strong example that reflects your abilities and interests. Then arrange the remaining pieces to create a coherent story about your development. You do not need to place projects in chronological order unless the instructions require it.
Keep fonts, spacing, headings, and image sizes consistent. Avoid crowded pages, distracting decorations, and long paragraphs that compete with the work itself. Your presentation should make the content easy to assess.
5. Write Short and Useful Project Descriptions
Each project should include enough information for a reviewer to understand what it is and why it matters. A short, specific description is usually more helpful than a long explanation.
Where appropriate, include:
Project title: A clear and accurate name.
Date: When you completed the work.
Purpose: The question, goal, or problem you explored.
Your contribution: What you personally created or completed.
Tools or methods: Software, materials, research methods, or techniques.
Learning outcome: What you discovered or improved.
For example:
Project: Student Community Website
Purpose: To create a simple website sharing information about school activities.
My contribution: I planned the page structure, wrote the content, designed the layout, and tested the website on different screen sizes.
Learning outcome: I improved my understanding of navigation, accessibility, and user-friendly design.
Keep every description accurate. If a project was completed in a team, explain your individual contribution clearly. Never present another person’s work as your own.
6. Demonstrate Originality and Personal Interest
Universities need to understand your individual perspective, not just your ability to follow instructions. Include work that reflects your genuine interests, curiosity, and approach to learning.
Personal projects can be valuable evidence of motivation. You might create a photo series about your community, investigate a scientific question, design a small digital tool, or write about a topic you want to explore further.
Originality does not mean every project must be completely new or unusual. It means showing your own decisions, ideas, and contribution. You can learn from existing artists, researchers, designers, or developers, but clearly distinguish their work from yours and credit sources where appropriate.
Avoid copying portfolio examples from the internet or using templates that make your work look more advanced than it is. An honest presentation of your current abilities and potential is stronger than an exaggerated one.
7. Make Your Digital Portfolio Easy to Review
Many universities use online systems to collect portfolio submissions. Before uploading your work, make sure the files are clear, readable, and compatible with the requested format.
For a PDF portfolio, check that images are sharp, text is legible, and pages display correctly on a computer screen. Compress the file if necessary, but do not reduce image quality so much that important details become difficult to see.
Use a professional file name, such as FirstName_LastName_Portfolio.pdf, unless the university specifies another naming convention. If you include links to websites, videos, or digital projects, test every link and confirm that reviewers can access it without requesting special permissions.
Also check spelling, grammar, page numbering, and project labels. A final review can help you identify missing pages, broken links, unclear descriptions, or accidental errors before submission.
8. Ask for Feedback and Improve Your Portfolio
Before submitting your student portfolio for university applications, ask a teacher, mentor, or knowledgeable person to review it. Someone unfamiliar with your projects can tell you whether the purpose and quality of each piece are easy to understand.
Ask specific questions:
Does the portfolio clearly connect to my chosen course?
Are my strongest projects easy to identify?
Do the descriptions explain my contribution?
Is the layout consistent and readable?
Are there any missing requirements or confusing sections?
Use feedback to improve the portfolio, but retain ownership of your work and decisions. You should be able to explain every project and discuss what you learned from it, particularly if the application includes an interview or portfolio review.
Finally, leave enough time to revise your materials and submit them before the deadline. Last-minute changes can lead to missing files or avoidable mistakes.
Common Portfolio Mistakes to Avoid
Even good work can be difficult to assess when it is poorly presented. Avoid these common problems:
Ignoring course requirements: A polished portfolio can still be unsuitable if it does not follow the university’s instructions.
Including too much work: Too many examples can weaken the overall presentation. Select work carefully.
Using unclear descriptions: Reviewers should understand what you did and why the project is relevant.
Hiding collaboration: State your role in group projects and credit other contributors.
Overdesigning the layout: Decorative elements should not distract from the work.
Submitting untested files: Open the final PDF, test links, and check file permissions before uploading.
Waiting until the last minute: Allow time for feedback, revisions, and technical problems.
Final Checklist Before Submission
Use this checklist to review your portfolio before sending it to a university.
I have checked the official requirements for each course.
My selected work is relevant to my intended subject.
My strongest projects are easy to identify.
Project titles, dates, and descriptions are accurate.
I have explained my role in collaborative work.
I have credited external sources and materials where needed.
The layout is consistent and the text is readable.
All files and links work correctly.
The file format, size, and naming convention meet the requirements.
I have checked the deadline and submission confirmation.
Frequently Asked Questions
What should I include in a student portfolio for university applications?
Include work that demonstrates your relevant skills, interests, and potential. Depending on your course, this could mean artwork, writing samples, research projects, coding examples, designs, or extracurricular work. Follow the university’s specific instructions before choosing your materials.
How many projects should a university portfolio contain?
There is no universal number. Some universities specify an exact number or maximum, while others provide broader guidance. Check the official requirements and focus on presenting your strongest relevant work rather than aiming for an arbitrary total.
Can I include school assignments in my portfolio?
Yes, if the university accepts them and they demonstrate relevant skills. You can also include independent or personal projects when permitted. Clearly explain the purpose of each piece and your own contribution.
Does a university portfolio need to be professionally designed?
No. It should be clear, organized, and easy to review, but it does not need expensive software or elaborate visual effects. A simple, consistent layout can present your work effectively.
When should I start preparing my portfolio?
Start as soon as you identify the courses that interest you, especially if you need to create new work. Early preparation gives you time to research requirements, develop projects, ask for feedback, and correct problems before the deadline.
Conclusion
Building a strong portfolio takes planning, careful selection, and honest presentation. The best portfolio is not necessarily the longest or most visually elaborate; it is one that clearly demonstrates your abilities, interests, development, and suitability for your chosen course.
Research each university’s requirements, choose relevant work, explain your contribution, and make the final submission easy to navigate. With enough time and thoughtful preparation, your portfolio can help admissions teams see more of what you can bring to university and what you hope to learn next.
Laboratory classes give students the opportunity to explore scientific concepts through experiments, observations, and hands-on activities. Whether you are working in a chemistry, biology, physics, or school science laboratory, practical work can help you understand how scientific principles operate in real situations. However, laboratories also contain potential hazards, including chemicals, heat, glassware, electrical equipment, biological materials, and specialized instruments.
Learning the laboratory safety rules for students is essential before beginning any practical activity. Following safety procedures helps reduce the risk of injuries, prevents contamination, protects laboratory equipment, and creates a safer environment for everyone.
In this guide, you will learn the most important laboratory safety rules, how to use personal protective equipment, how to handle chemicals and laboratory equipment responsibly, what to do during an emergency, and how to develop safe habits that support successful scientific learning.
Why Are Laboratory Safety Rules Important?
Laboratory safety rules are designed to reduce risks and help students perform experiments responsibly. Even a simple classroom activity can become dangerous if equipment is used incorrectly, materials are handled carelessly, or instructions are ignored.
Following laboratory safety procedures helps students:
Prevent injuries: Proper handling of chemicals, glassware, heat sources, and equipment reduces avoidable risks.
Protect classmates and teachers: Unsafe behavior can affect everyone working in the laboratory.
Prevent contamination: Clean equipment, appropriate protective gear, and correct waste disposal help protect samples and experimental results.
Maintain reliable results: Contamination, damaged equipment, and inconsistent procedures can affect experimental observations.
Respond effectively to emergencies: Knowing where emergency equipment is located helps students act promptly when something goes wrong.
Develop professional habits: Safe working practices are essential in scientific research, healthcare, engineering, and many technical careers.
Laboratory safety is not simply a list of rules to memorize. It is a habit of identifying hazards, following approved procedures, and asking for guidance whenever something is unclear.
1. Follow Your Teacher’s Instructions
The first rule of laboratory safety is to follow your teacher’s or laboratory supervisor’s instructions at all times.
Before starting an experiment, listen to the explanation, read the procedure, and make sure you understand the purpose of each step. Do not begin handling chemicals or equipment until you have been authorized to do so.
Students should:
Perform only experiments approved for their class.
Follow the written procedure and the instructor’s directions.
Ask questions whenever an instruction is unclear.
Never change the procedure without permission.
Use equipment only after receiving the necessary training.
Never work alone on an experiment that requires supervision.
If you are unsure whether a material or instrument is safe to use, stop and ask the instructor. Guessing can create unnecessary risks.
2. Wear Appropriate Personal Protective Equipment
Personal protective equipment, commonly called PPE, helps protect the body from specific laboratory hazards. The required equipment depends on the materials, procedures, and risks involved.
  Use the type of eye protection required for the experiment. Chemical splash goggles may be necessary when liquids could splash or hazardous materials could reach the eyes. Ordinary glasses or fashion eyewear may not provide adequate protection.
</box>
</row> <divider color=”subtle” /> <row align=”start” gap={3}> <AsyncImage query=”white long sleeve laboratory coat hanging in science laboratory” aspectRatio=”3:4″ maxWidth=”112px”/> <box flex=”1″ gap={1}> **Laboratory coat or apron**
  Wear the protective clothing specified for the activity. A lab coat can help protect skin and everyday clothing from splashes and contamination, but it does not replace other required protective measures.
</box>
  Wear gloves when the procedure requires them, and choose a material compatible with the hazard. Not all gloves protect against all chemicals. Remove contaminated gloves safely and never use them to touch phones, door handles, or personal belongings.
</box>
</row> <divider color=”subtle” /> <row align=”start” gap={3}> <AsyncImage query=”closed toe protective shoes worn in science laboratory student feet” aspectRatio=”3:4″ maxWidth=”112px”/> <box flex=”1″ gap={1}> **Appropriate footwear and clothing**
  Wear closed-toe shoes and clothing that covers the body as required by your laboratory's rules. Avoid sandals, loose sleeves, dangling jewelry, and clothing that could catch on equipment or come into contact with hazardous materials.
</box>
</row> </box>
Long hair should be tied back, and loose clothing should be secured before beginning practical work. Additional protection, such as a face shield or specialized gloves, may be required for certain activities.
Remember that PPE is only one part of laboratory safety. It must be used alongside appropriate equipment, training, procedures, and supervision.
3. Read Experiment Instructions Before Starting
Never begin an experiment without understanding the procedure and its potential hazards.
Read the instructions carefully before collecting materials or operating equipment. Identify any warnings, required protective equipment, handling precautions, and disposal instructions.
Before starting, make sure you know:
The purpose of the experiment.
Which materials and equipment are needed.
The steps that must be followed.
Which hazards are associated with the procedure.
Where emergency equipment is located.
How the materials and waste must be handled afterward.
If the procedure contains unfamiliar terms or symbols, ask your instructor to explain them.
Preparing before an experiment reduces confusion and helps you avoid mistakes caused by rushing or improvising.
4. Keep Food and Drinks Out of the Laboratory
Eating and drinking in laboratories can expose students to hazardous substances through contaminated hands, surfaces, containers, or food packaging.
For this reason, do not eat, drink, chew gum, or store food in laboratory work areas where prohibited. Never use laboratory glassware, containers, refrigerators, or equipment for food or beverages.
Other important habits include:
Do not taste laboratory chemicals or samples.
Never use your mouth to draw liquid into a pipette.
Do not apply cosmetics in areas where laboratory materials may contaminate them.
Wash your hands before eating after leaving the laboratory.
Keep personal water bottles and snacks in the designated area outside the laboratory.
Even if a substance appears harmless, its identity or contamination status may be uncertain. Follow the laboratory’s rules rather than making assumptions.
5. Handle Chemicals Carefully
Chemicals can have different hazards, including toxicity, corrosiveness, flammability, and reactivity. Some may be dangerous if inhaled, swallowed, or allowed to contact the skin or eyes.
Always follow the specific instructions provided by your teacher, laboratory supervisor, product label, and applicable safety information.
Read chemical labels
Check the container label before using any chemical. Confirm its identity, concentration when relevant, hazard warnings, and handling instructions.
Never use an unlabeled or unidentified substance. If a label is missing or unclear, leave the container undisturbed and inform the instructor.
Never taste or directly smell chemicals
Do not taste chemicals or deliberately inhale their vapors. If an approved procedure requires an odor assessment, follow the instructor’s specific method and safety controls. Students should never improvise this step.
Use the correct equipment
Use approved tools, such as suitable pipettes or dispensers, to transfer liquids. Never use your mouth to operate a pipette.
Do not touch chemicals with bare hands or assume that gloves make every substance safe to handle.
Do not mix chemicals without permission
Some substances react dangerously when combined. Only mix materials as directed in an approved procedure.
Never return unused chemicals to the original container unless instructed
Returning material may contaminate the original supply. Follow your laboratory’s procedure for handling leftover chemicals.
Use a fume hood when required
Certain procedures generate hazardous vapors, gases, or aerosols. A properly functioning fume hood or other approved containment system may be necessary. Do not assume that opening a window or wearing a mask is an adequate substitute.
6. Understand Chemical Hazard Symbols
Chemical containers may display hazard pictograms that communicate important risks. Learning to recognize them helps students identify potential dangers before handling a substance.
Common hazard categories include:
Hazard category
What it indicates
Flammable
The material may ignite readily under specified conditions.
Corrosive
The material can damage skin, eyes, or certain metals.
Acute toxicity
Exposure may cause harmful or potentially fatal effects.
Irritant or harmful
The material may cause irritation or other health effects.
Oxidizing
The substance may intensify a fire or support combustion.
Explosive
The material may present an explosion hazard under specified conditions.
Gas under pressure
The container holds gas under pressure and may present additional hazards.
Serious health hazard
The substance may be associated with certain serious or long-term health effects.
Environmental hazard
The substance may be harmful to aquatic organisms or the environment.
A pictogram alone does not provide all the information needed to use a chemical safely. Read the label and consult the safety data sheet or instructor’s guidance for the specific substance.
7. Use Laboratory Equipment Correctly
Laboratory instruments are designed for particular purposes. Using them incorrectly can cause injuries, damage equipment, or produce unreliable results.
Follow these rules when using common laboratory equipment:
Glassware: Inspect glassware for cracks, chips, or other damage before use. Do not use damaged items.
Heating equipment: Use only the approved method and suitable heat-resistant tools. Treat glassware and liquids as hot until confirmed otherwise.
Electrical instruments: Keep electrical equipment away from liquids unless it is designed for the environment. Never handle electrical equipment with wet hands.
Microscopes: Carry and operate microscopes according to instructions, and avoid forcing adjustment mechanisms.
Centrifuges and moving equipment: Receive training before use, secure samples correctly, and follow the manufacturer’s and supervisor’s procedures.
Sharps: Handle needles, blades, and other sharp objects only when authorized, and dispose of them in designated sharps containers.
Never attempt to repair a malfunctioning instrument yourself. Stop using it, keep others away if necessary, and inform your teacher or laboratory supervisor.
8. Follow Safe Practices When Heating Materials
Heating is common in chemistry, biology, and physics laboratories, but it can create risks from burns, fires, hot liquids, and broken glassware.
When an experiment involves heat:
Understand the heating procedure before starting.
Use the required eye protection and other PPE.
Keep flammable materials away from heat sources.
Use appropriate holders, clamps, tongs, or heat-resistant gloves when required.
Never leave a heating process unattended unless the approved procedure specifically provides for it.
Do not point the opening of a heated test tube toward yourself or another person.
Avoid touching hot equipment or glassware until it has cooled sufficiently.
Switch off heating equipment as directed when it is no longer needed.
Never heat a sealed container unless the procedure and equipment are specifically designed and approved for that purpose. Pressure can build up and cause a dangerous failure.
If you are unsure whether an object is hot, do not test it by touching it with your bare hand. Ask your instructor or use the approved method for checking its temperature.
9. Keep Your Workspace Clean and Organized
A tidy laboratory is easier to work in and reduces the likelihood of spills, breakages, contamination, and other incidents.
Before starting an experiment, keep only the materials you need on the bench. Store bags, jackets, and unnecessary books in the designated area.
During the experiment:
Keep walkways and exits clear.
Place equipment where it cannot easily be knocked over.
Keep container lids and tools organized as instructed.
Do not leave spills or broken items unreported.
Avoid placing personal items on laboratory work surfaces.
At the end of the session, clean and restore the workspace according to your instructor’s directions.
Never clean an unknown chemical spill or broken hazardous material yourself. Alert the instructor and follow the laboratory’s spill-response procedure.
10. Dispose of Laboratory Waste Properly
Different laboratory materials require different disposal methods. Chemical waste, biological waste, broken glass, sharps, and ordinary rubbish should not automatically be treated in the same way.
Incorrect disposal can expose other people to hazards, damage plumbing or equipment, or harm the environment.
Follow these rules:
Use the designated container for each type of waste.
Never pour chemicals down a sink unless the approved procedure specifically permits it.
Dispose of broken glass in the designated broken-glass container, not loose in ordinary rubbish.
Place sharps in approved sharps containers.
Follow instructions for biological materials and contaminated disposable equipment.
Do not combine waste chemicals unless specifically instructed.
Ask your teacher how to handle any material whose disposal requirements are unclear.
Some materials require special treatment, containment, labeling, or collection by trained personnel. Students should not attempt to improvise a disposal method.
11. Know Where Emergency Equipment Is Located
Before beginning practical work, learn the location of emergency exits, first-aid supplies, fire alarms, and other safety equipment relevant to the laboratory.
Depending on the facility and hazards, emergency equipment may include:
<box gap={3}> <row align=”start” gap={3}> <AsyncImage query=”laboratory emergency eyewash station with two eye wash nozzles” aspectRatio=”3:4″ maxWidth=”112px”/> <box flex=”1″ gap={1}> **Emergency eyewash station**
  Used to flush the eyes after certain exposures. Learn how to activate it and follow the laboratory's emergency procedure immediately if a splash reaches your eyes.
</box>
  Used for appropriate body exposures, such as significant chemical contamination of the skin or clothing. Know how to reach it quickly.
</box>
</row> <divider color=”subtle” /> <row align=”start” gap={3}> <AsyncImage query=”red wall mounted fire extinguisher in university science laboratory” aspectRatio=”3:4″ maxWidth=”112px”/> <box flex=”1″ gap={1}> **Fire safety equipment**
  Learn the location of fire alarms and the laboratory's fire-response equipment. Students should only attempt to use a fire extinguisher if trained, authorized, and able to do so without endangering themselves.
</box>
  Identify the nearest safe exit and the designated assembly point. Keep routes clear and follow staff instructions during an evacuation.
</box>
</row> </box>
Never block emergency equipment with bags, boxes, or laboratory materials. If you do not know where something is located, ask before beginning the experiment.
12. Know What to Do If an Accident Occurs
Accidents and near misses should be reported promptly, even if an injury initially appears minor. Quick reporting allows trained staff to assess the situation and take appropriate action.
If a chemical contacts your eyes or skin
Alert the instructor immediately and use the appropriate emergency eyewash or safety shower without delay, following the facility’s established procedure. For many chemical exposures, immediate, thorough flushing is essential. Obtain medical assistance as directed by the emergency procedure and the substance’s safety information.
Do not delay flushing while searching online for advice or trying to identify the chemical.
If a chemical spills
Keep away from the spill and notify your instructor. Do not touch, smell, wipe up, or attempt to neutralize an unknown substance. Trained personnel should determine the appropriate response.
If glass breaks
Do not pick up broken glass with your bare hands. Inform the instructor and follow the approved cleanup and disposal procedure.
If a fire occurs
Alert others and activate the appropriate alarm or emergency procedure. Evacuate when directed and use the designated route. Do not attempt to fight a fire unless you have the necessary training, authorization, and a safe escape route.
If someone is injured
Inform the instructor or designated emergency responder immediately. Do not move a seriously injured person unless remaining in place presents an immediate danger. Follow emergency instructions and seek medical assistance as required.
Important: Always follow the specific emergency procedures posted in your school or university laboratory. This article is general educational guidance and does not replace local training or professional emergency response.
13. Follow Biological Safety Rules
Biology and microbiology laboratories may involve microorganisms, biological specimens, human or animal materials, and other substances that require special precautions.
Students should follow the containment and hygiene rules established for their specific activity.
Important practices include:
Handle biological specimens only when authorized and trained.
Wear the protective equipment specified for the task.
Avoid touching your face or personal belongings with contaminated gloves.
Wash your hands after handling biological materials and before leaving the laboratory.
Never take biological specimens or cultures out of the laboratory without authorization.
Use approved containers for biological waste.
Follow instructions for cleaning and disinfecting work surfaces.
Report cuts, spills, accidental exposures, or damaged containment immediately.
Not all biological materials carry the same level of risk. Follow the laboratory’s instructions rather than assuming that a sample is harmless because it looks ordinary.
14. Protect Yourself When Working With Electrical Equipment
Physics and other science laboratories may use power supplies, circuits, motors, sensors, and electronic measuring instruments.
Electrical safety requires careful setup and attention to equipment condition.
Follow the approved circuit diagram and instructor’s directions.
Check equipment for visible damage before use.
Keep hands dry when operating electrical equipment.
Keep liquids away from equipment unless the setup is specifically designed for that use.
Do not touch exposed electrical conductors.
Disconnect power according to the approved procedure before making changes to a circuit.
Never use damaged cables, plugs, or instruments.
Report sparks, unusual smells, overheating, or malfunction immediately.
Do not attempt to repair electrical equipment or investigate a suspected electrical fault yourself. Stop the activity and alert the instructor.
15. Wash Your Hands and Remove Protective Equipment Correctly
Good hygiene is an essential part of laboratory safety. Materials can remain on gloves, clothing, tools, and surfaces even when contamination is not visible.
Wash your hands thoroughly with soap and water at the appropriate times, including after handling laboratory materials and before leaving the laboratory.
Also remember to:
Remove gloves without touching the contaminated outer surface with bare skin.
Dispose of disposable PPE in the correct waste container.
Clean or store reusable protective equipment according to instructions.
Remove laboratory coats and gloves before entering areas where they are not permitted.
Avoid carrying contamination into classrooms, corridors, cafeterias, or personal vehicles.
Never assume that wearing gloves eliminates the need for handwashing. Gloves can tear, become contaminated, or transfer substances to other surfaces.
16. Maintain Accurate Records and Follow the Procedure
Laboratory safety and accurate scientific work are closely connected. Clear records help students understand what they did, identify unexpected results, and explain what happened if an incident or equipment problem occurs.
Record observations and measurements as instructed. Label samples and containers correctly, and do not make unapproved changes to experimental procedures.
If a result seems unexpected, do not repeat an unsafe action simply to obtain a different result. Stop and consult your instructor.
If an equipment problem, spill, or procedural mistake occurs, report it honestly. Concealing an incident can increase the risk to other people and make it harder to determine what happened.
A safe laboratory is one where students can ask questions, acknowledge mistakes, and learn from evidence without taking unnecessary risks.
17. Common Laboratory Safety Mistakes to Avoid
Even students who know the rules may make mistakes when they become distracted, rushed, or overconfident.
Avoid these common errors:
Mistake
Safer approach
Starting before instructions are clear
Read the procedure and ask the instructor for clarification.
Wearing unsuitable clothing
Follow the laboratory’s clothing and PPE requirements.
Using an unidentified chemical
Do not use it; notify the instructor.
Mixing substances without permission
Follow only the approved procedure.
Touching hot glassware
Use approved tools and allow equipment to cool as directed.
Leaving a spill unattended
Alert the instructor and follow the spill-response procedure.
Disposing of all waste in one bin
Use the designated waste container for each material.
Handling damaged equipment
Stop using it and report the problem.
Wearing contaminated gloves outside the lab
Remove and dispose of or store PPE according to instructions.
Hiding an accident or near miss
Report it promptly so the risk can be assessed.
A simple way to remember these practices is to pause before each experiment and ask three questions: Do I understand the procedure? Do I have the required protection? Do I know what to do if something goes wrong?
Laboratory Safety Checklist for Students
Use this checklist before, during, and after a practical session. It complements your instructor’s instructions and the rules specific to your laboratory.
{@body const safetyTasks = [{heading:”Before the experiment”,items:[“Read the procedure and understand the hazards.”,”Wear the required PPE and appropriate clothing.”,”Tie back long hair and secure loose clothing.”,”Locate emergency exits and relevant safety equipment.”,”Check that equipment is suitable and undamaged.”]},{heading:”During the experiment”,items:[“Follow the approved procedure and instructor’s directions.”,”Handle chemicals and equipment only as trained.”,”Keep the work area organized and walkways clear.”,”Never eat, drink, taste chemicals, or improvise mixtures.”,”Report spills, injuries, near misses, and equipment problems.”]},{heading:”After the experiment”,items:[“Dispose of waste using the designated procedures.”,”Clean the work area as instructed.”,”Remove PPE safely and store reusable equipment correctly.”,”Wash hands thoroughly before leaving.”,”Report any unresolved safety concern to the instructor.”]}]} {@body const [checkedTasks, setCheckedTasks] = DIL.useState([])} <box border radius=”lg” padding={3} gap={3}> <row align=”center” justify=”between”> <title size=”md”>My lab safety checklist</title> <text color=”secondary” size=”sm”>{checkedTasks.length} of 15</text> </row> <box background=”surface-tertiary” radius=”full” height=”6px” clip> <box background=”surface-inverted” radius=”full” height=”6px” width={${checkedTasks.length / 15 * 100}%} /> </box> {#each safetyTasks as group, groupIndex} <box gap={2} key={group.heading}> <text weight=”medium”>{group.heading}</text> {#each group.items as task, taskIndex} <checkbox key={${groupIndex}-${taskIndex}} checked={checkedTasks.includes(${groupIndex}-${taskIndex})} onChange={(isChecked) => setCheckedTasks(previous => isChecked ? […previous, ${groupIndex}-${taskIndex}] : previous.filter(item => item !== ${groupIndex}-${taskIndex}))}>{task}</checkbox> {/each} </box> {/each} <row> <button variant=”outline” color=”secondary” onClick={() => setCheckedTasks([])}>Reset checklist</button> </row> </box>
Frequently Asked Questions About Laboratory Safety
What are the most important laboratory safety rules for students?
The most important rules include following instructor directions, wearing appropriate PPE, reading experiment instructions, handling chemicals and equipment correctly, avoiding food and drinks in the laboratory, disposing of waste properly, and reporting accidents immediately.
Why should students wear safety goggles in the laboratory?
Safety goggles help protect the eyes from hazards such as chemical splashes and flying particles. The type of eye protection must match the activity. Ordinary glasses may not provide the splash protection required for certain experiments.
Why is eating or drinking prohibited in many laboratories?
Food and drinks may become contaminated by hazardous substances on hands, surfaces, or equipment. Keeping them outside laboratory work areas reduces the risk of accidentally swallowing contaminants.
What should students do if a chemical spills?
Move away from the spill if necessary and notify the instructor immediately. Do not touch, smell, or attempt to clean an unknown chemical. Follow the laboratory’s spill-response procedure and allow trained personnel to assess the situation.
What should students do if a chemical gets into their eyes?
Alert the instructor and immediately use the designated eyewash station according to the laboratory’s emergency procedure. Continue the required flushing and obtain medical assistance as directed. Do not delay emergency action while trying to identify the chemical.
Why should laboratory waste be separated?
Different types of waste may require different handling and disposal methods. Separating chemical waste, biological materials, sharps, broken glass, and ordinary rubbish helps reduce exposure risks and supports proper disposal.
Can students perform laboratory experiments without supervision?
Students should not perform experiments that require supervision without the required instructor or authorized supervisor. Follow the rules for your particular facility, course, and activity, and never undertake unauthorized laboratory work.
Why is handwashing important after laboratory work?
Handwashing helps remove contaminants that may remain on the skin after handling equipment or materials. It is important even when gloves have been worn because gloves can tear or transfer contamination to other surfaces.
How can students prepare for a safe laboratory session?
Read the procedure before class, learn the hazards, wear the required protective equipment, identify emergency exits and safety equipment, and ask questions about anything you do not understand. Preparation helps prevent avoidable mistakes.
Conclusion
Understanding laboratory safety rules for students is essential for successful and responsible practical learning. From wearing appropriate protective equipment and handling chemicals carefully to using equipment correctly and responding to emergencies, every safety practice helps reduce risk and protect the people working in the laboratory.
The most important habit is to take safety seriously before, during, and after every experiment. Read instructions, follow your teacher’s directions, keep your workspace organized, dispose of waste correctly, and report hazards or accidents without delay.
Laboratory safety is a shared responsibility. When students develop careful working habits and understand why the rules matter, they help create an environment where everyone can learn, investigate scientific questions, and conduct experiments more responsibly.
Poland offers a varied setting for students interested in medical training. Its higher education landscape includes institutions with different academic profiles, allowing learners to compare theoretical study with practical preparation. The field brings together anatomy, physiology, and clinical reasoning, but success also depends on curiosity, steady effort, and the ability to ask informed questions. A useful starting point is to understand how a course is organized, what its learning outcomes mean, and how students can build experience beyond lectures. This article explores the academic journey, the learning environment, and possible next steps for students considering this area in Poland.
Choosing a Suitable Programme
Choosing a programme requires more than reading a university ranking or selecting an attractive city. Prospective students should examine course descriptions, language of instruction, admission criteria, and the balance between required and elective modules. In medical training, attention to anatomy, physiology, and clinical reasoning can reveal whether a degree matches personal interests. Students should also check the institution’s official website for current requirements, because programme details and application dates can change. Comparing several options, reviewing the curriculum semester by semester, and contacting an admissions office can prevent misunderstandings before an application is submitted.
Academic Foundations
The early stages of medical training usually emphasize foundations that support more advanced work. Students encounter ideas connected with anatomy, physiology, and clinical reasoning and learn to apply them systematically rather than memorizing isolated facts. Tutorials, readings, and regular assignments can reinforce lecture material. Effective study habits include keeping clear notes, reviewing difficult concepts promptly, and discussing problems with classmates. A strong foundation matters because later modules often assume that students can connect several earlier topics. It also makes it easier to recognize where an individual’s strengths and interests lie.
Learning Through Practice
Practical learning gives academic concepts a clearer purpose. Depending on the programme, students may experience simulation rooms and supervised clinical placements and receive feedback from instructors or project supervisors. These activities encourage them to plan their work, record results carefully, and explain the reasons behind decisions. Mistakes can become useful learning opportunities when they are reviewed openly and corrected methodically. Students should look for courses that explain how practical work is assessed and what equipment or resources are available. A portfolio of completed assignments can later demonstrate progress more effectively than a list of course titles alone.
Campus Resources and Student Support
An effective learning environment extends beyond the classroom. In Poland, students can explore medical universities and teaching hospitals, as well as libraries, consultation hours, and student societies where available. Academic advisers may help with module choices, while international offices can clarify administrative procedures for students arriving from abroad. Support services vary by institution, so applicants should verify what a particular university provides. Joining a study group, attending a faculty event, or speaking with senior students can make an unfamiliar academic system easier to navigate. Taking advantage of resources early often helps students build confidence and independence.
Developing Transferable Skills
Technical knowledge is only one part of academic preparation. Students working in medical training also benefit from patient communication and medical ethics. Group assignments offer opportunities to divide responsibilities, communicate progress, and resolve disagreements respectfully. Written reports and presentations help learners explain complicated ideas to people who may not share their background. Managing deadlines across several modules teaches realistic planning. These abilities matter in further study and employment because complex projects rarely depend on one person or one type of expertise. Students can improve them deliberately by requesting feedback and reflecting on completed work.
Research and Independent Projects
Research creates opportunities to investigate questions that do not have a single ready-made answer. In medical training, projects related to evidence-based medicine and clinical research can introduce students to literature reviews, research methods, and careful interpretation of findings. A supervisor can help narrow a broad interest into a manageable question. Students should distinguish reliable evidence from unsupported claims and document sources consistently. Not every degree requires extensive research, yet even a small independent project can strengthen analytical habits. Presenting results at a student seminar or preparing a final thesis may also clarify whether postgraduate study is an appealing direction.
Preparing for Future Opportunities
Career planning is most useful when it begins before graduation. Possible directions associated with this subject include hospital practice and further specialization, although actual opportunities depend on qualifications, experience, language ability, and labour-market conditions. Internships, university career events, and carefully chosen projects can help students test their interests. A clear CV should describe responsibilities and measurable contributions without exaggeration. Students considering regulated professions must check the applicable licensing and recognition rules separately. Building relationships with instructors and classmates can provide valuable guidance, but each student should make decisions based on verified requirements and personal goals.
Conclusion
Studying medical training in Poland can combine structured academic learning with practical experience and broader personal development. The most useful approach is to compare programmes carefully, strengthen fundamentals, seek constructive feedback, and remain open to new areas of interest. Students who use available resources and document their progress can make better-informed choices about research, employment, or further education. Rather than relying on general promises about a degree, applicants should check the details of each institution and build a study plan that fits their circumstances. Consistent effort and thoughtful exploration remain central to a rewarding educational experience.
Statistical thinking is an essential skill for students who want to understand research, interpret data, and make evidence-based decisions. Whether you are studying biology, psychology, economics, business, education, or the social sciences, you will often encounter averages, percentages, graphs, surveys, and research findings. Knowing how to calculate these values is useful, but understanding what they actually mean is even more important.
Developing statistical thinking for students involves learning to ask meaningful questions, recognize patterns, understand variation, evaluate evidence, and interpret results in context. It also means knowing when data is incomplete, when a conclusion is uncertain, and when a statistic might create a misleading impression.
The good news is that statistical thinking is not limited to students who are naturally good at mathematics. You can develop it through regular practice, careful observation, and a habit of questioning how information is collected and interpreted.
In this guide, you will learn what statistical thinking means, why it matters in academic studies, which skills to develop, and how to apply statistical reasoning through practical examples and everyday study activities.
What Is Statistical Thinking?
Statistical thinking is the ability to use data to understand questions, recognize patterns, account for variation, and draw reasonable conclusions while considering uncertainty.
It goes beyond performing calculations. A student with strong statistical thinking asks where the data came from, what the numbers represent, how much the observations differ, and whether the evidence supports the conclusion being presented.
For example, imagine that a student reads a report claiming that students who study for longer periods achieve higher examination scores. Instead of immediately accepting the claim, the student considers several questions:
How many students participated in the study?
How were the participants selected?
How was study time measured?
Were other factors, such as previous academic performance, considered?
Does the evidence show an association or establish a cause?
Would the results apply to students in other schools or universities?
These questions demonstrate statistical thinking because they focus on the quality, meaning, and limitations of the evidence rather than the numbers alone.
Statistical thinking is especially important when data varies from one observation to another. Two students may study for the same amount of time and earn different scores. Two experiments may produce slightly different results. A survey may reveal a general preference without representing every individual.
Understanding these differences is central to interpreting data responsibly.
Why Is Statistical Thinking Important for Students?
Statistical reasoning is useful across academic disciplines because research and decision-making often involve incomplete information, variation, and uncertainty.
1. It improves critical thinking
Statistical thinking encourages you to question claims instead of accepting them automatically. You learn to look for supporting evidence, consider alternative explanations, and identify weaknesses in an argument.
This is useful when evaluating textbook examples, research papers, online articles, and claims based on surveys or experiments.
2. It strengthens research skills
Academic research depends on collecting appropriate information and interpreting it accurately. Students who understand statistical thinking are better prepared to design surveys, analyze experimental results, compare groups, and explain their findings.
3. It helps you understand data visualizations
Graphs, tables, and charts can reveal important patterns, but they can also be misinterpreted. Statistical thinking helps you examine scales, compare values, identify variation, and recognize when a visual presentation exaggerates a difference.
4. It supports evidence-based decisions
Students regularly make decisions about study strategies, time management, academic goals, and research topics. Statistical thinking helps them distinguish meaningful patterns from isolated observations.
5. It builds confidence with statistics
Many students believe statistics is mainly about formulas and complicated calculations. Developing a conceptual understanding of data makes those calculations easier to interpret and apply.
The goal is not to memorize every statistical technique. It is to understand which questions a technique can answer and what its results can reasonably tell you.
1. Learn to Ask Good Statistical Questions
Statistical thinking begins with asking a question that can be investigated using data.
Not every question is statistical. A question such as “What is the capital of France?” has a factual answer that does not require analyzing variation in data. In contrast, “How many hours do students in my class typically spend studying each day?” is statistical because the answer may differ from one student to another.
Good statistical questions usually involve a group, a measurable characteristic, and an expectation that the observations may vary.
Examples include:
How much time do university students spend studying each week?
Do examination scores differ between two teaching methods?
How does daily temperature vary throughout a month?
What percentage of students prefer digital textbooks?
Is there an association between attendance and academic performance?
To develop this skill, start with a topic that interests you and turn it into a specific question.
For example, instead of asking, “Are students good at mathematics?” ask, “What is the distribution of mathematics examination scores among students in this class?”
The second question is more useful because it identifies a group and a measurable outcome.
Before collecting data, consider what information would answer the question, how it should be measured, and what limitations might affect the results.
2. Understand Variation in Data
One of the most important parts of statistical thinking is understanding variation.
Variation means that observations are not all identical. Students have different examination scores, plants grow at different rates, and daily temperatures change. Even repeated measurements of the same object can differ slightly because of measurement limitations or changing conditions.
Statistical analysis helps us describe, compare, and understand these differences.
Why variation matters
Imagine two classes with the same average examination score of 75.
Class A has scores that are mostly between 72 and 78. Class B has scores ranging from 45 to 100.
Although the classes share the same average, their results are distributed very differently. The average alone does not reveal how consistently students performed.
To understand the difference, you would need to examine the distribution and spread of the scores.
Important measures of variation
Range: The difference between the highest and lowest values.
Interquartile range (IQR): The spread of the middle 50% of the data.
Variance: A measure based on squared deviations from the mean.
Standard deviation: A measure of how spread out values are around the mean.
You do not need to master every formula immediately. Begin by learning what each measure describes and when it is useful.
For example, the range is easy to calculate but depends only on the two extreme values. Standard deviation uses information from the full dataset and provides a more detailed measure of spread around the mean.
Practical exercise: Collect a small set of examination scores, calculate the mean and range, and then look at the individual scores. Ask yourself whether the average gives a complete picture of performance.
3. Learn to Interpret Averages Correctly
Averages are among the most frequently reported statistics in academic studies. However, the word “average” can refer to different measures, and each one provides a different view of the data.
Mean
The mean is calculated by adding all values and dividing by the number of observations.
For example, consider these five fictional quiz scores:
70, 75, 80, 85, 90
The mean is:
[ \frac{70+75+80+85+90}{5}=80 ]
The average score is 80.
Median
The median is the middle value when observations are arranged in order. For the five scores above, the median is also 80.
The median can be particularly useful when a dataset contains unusually high or low values.
Mode
The mode is the most frequently occurring value. A dataset can have one mode, multiple modes, or no repeated value.
Why choosing the right average matters
Suppose five students report studying for the following numbers of hours per week:
8, 9, 10, 11, 32
The mean is 14 hours, while the median is 10 hours.
The unusually high value of 32 hours pulls the mean upward. The median better represents the middle observation in this particular dataset.
Neither measure is automatically correct in every situation. The appropriate choice depends on the distribution, the research question, and the meaning of the data.
When you read an academic report, ask which measure is being used, why it was selected, and whether it adequately represents the observations.
4. Develop the Habit of Looking Beyond a Single Number
A statistic can summarize information efficiently, but it may hide important details.
A mean does not show every individual value. A percentage does not necessarily tell you how many people were surveyed. A reported increase does not automatically explain why the change occurred.
For example, two universities might report that 80% of their students passed an examination. At first glance, their results appear identical. However, one university may have 50 students and the other 5,000.
The percentages are the same, but the number of observations differs considerably. Sample size is one factor to consider when assessing how much confidence to place in a reported result.
Other important questions include:
How spread out are the observations?
Are there unusual values or outliers?
How large is the sample?
Are the groups being compared similar?
What time period does the data cover?
Is the reported difference practically meaningful?
A useful habit is to read the headline statistic and then look for the additional information needed to understand it.
5. Understand Samples and Populations
Academic research often studies a sample rather than every member of a population.
A population is the complete group that a researcher wants to understand. A sample is the subset of that group from which data is collected.
For example, if a researcher wants to investigate study habits among all first-year university students in a country, surveying every student may be impractical. The researcher may select a sample and use the collected data to estimate patterns in the wider population.
However, a sample does not automatically represent the population.
Consider how the sample was selected
Imagine that you want to understand how much university students exercise each week. You distribute a survey only in a sports club.
The respondents may exercise more frequently than the average university student. The results could therefore give a misleading picture of the wider population.
This is a potential source of selection bias.
When evaluating a sample, consider:
Whether the selection method is appropriate.
Whether important groups were excluded.
Whether the sample is large enough for the intended analysis.
Whether people who did not respond differ from those who did.
Whether the findings can reasonably be generalized to the target population.
A larger sample can reduce some forms of random sampling uncertainty, but size alone does not eliminate bias. A large, poorly selected sample can still produce misleading conclusions.
6. Learn to Recognize Bias in Data Collection
Bias occurs when a data collection or analysis process systematically distorts the results.
Recognizing potential bias is an essential part of statistical thinking because even accurate calculations cannot correct every problem in the underlying data.
Common forms of bias
Selection bias: Some members of the population are more likely than others to be included.
Response bias: Participants’ answers may be influenced by how a question is worded, the setting, or their desire to give a socially acceptable response.
Nonresponse bias: People who do not participate may differ in meaningful ways from those who respond.
Measurement bias: The method or instrument used to collect data systematically affects the measurements.
Example: A student satisfaction survey
Suppose a student wants to measure satisfaction with online classes. The survey asks:
“How much do you appreciate the convenience of our excellent online learning system?”
The wording assumes that the system is excellent and emphasizes its advantages. This may influence responses.
A more neutral question would be:
“How satisfied are you with your experience of online classes?”
The second question allows participants to express positive, negative, or neutral views without being directed toward a particular answer.
When reading a research study, examine how the data was collected. Ask whether the questions, instruments, recruitment process, or missing responses could have influenced the results.
7. Distinguish Correlation from Causation
One of the most important lessons in statistical thinking is that correlation does not automatically establish causation.
Correlation describes an association between variables. Causation means that a change in one factor produces a change in another, under an appropriate causal interpretation.
For example, a study might find that students who spend more time practicing questions tend to earn higher examination scores. This is a positive association.
However, the relationship alone does not prove that practice time caused the difference. Other factors may also contribute, including prior knowledge, access to learning resources, motivation, or the quality of the practice.
There may also be a reverse relationship in some settings: students who are already struggling might choose to spend more time studying.
Questions to ask when you see a correlation
Were the variables measured accurately?
Could another factor explain the association?
Does the research design support a causal conclusion?
Were participants randomly assigned to different conditions, where appropriate?
Do other studies support the same explanation?
Well-designed experiments can provide stronger evidence for causal claims than simple observational associations, although experimental design and limitations still matter.
Whenever you encounter the phrase “X is linked to Y,” do not automatically replace it with “X causes Y.”
8. Interpret Graphs, Tables, and Statistical Reports Carefully
Data visualization helps researchers communicate findings, but a chart or table should always be interpreted in context.
When reading a graph, start by checking its title, axes, units, scale, and legend. Then examine the pattern and compare important values.
A graph may show an increase over time, but that does not necessarily mean the increase is large or meaningful. A truncated axis may exaggerate a difference, while a short time period may hide a longer-term pattern.
Tables also require careful reading. Make sure you understand the row and column headings and whether the figures represent counts, percentages, averages, or another measure.
For statistical reports, look beyond the main result and check the sample size, methods, uncertainty, and limitations.
A useful approach is to summarize each figure in three parts:
Observation: What does the graph or table show?
Evidence: Which values or patterns support that observation?
Interpretation: What does the pattern mean for the research question?
This method helps you avoid making claims that go beyond the data.
9. Learn to Think About Probability and Uncertainty
Statistical conclusions are rarely certain in the same way as a simple arithmetic calculation. Researchers often work with samples, imperfect measurements, and processes that naturally vary.
Probability provides a framework for reasoning about uncertainty.
For example, if you toss a fair coin, the probability of heads on a single toss is 50%. This does not mean that exactly half of every small group of tosses must produce heads. Random variation can lead to different results in different sets of tosses.
Similarly, two samples drawn from the same population may produce slightly different averages.
What statistical uncertainty means
Suppose two studies estimate that students spend an average of around 12 hours per week studying. Their estimates may differ because of sampling variation, differences in how study time was measured, or differences between the populations being studied.
When interpreting research, pay attention to:
Confidence intervals, when reported.
Standard errors and other measures of uncertainty.
Sample size and sampling methods.
Whether the difference between estimates is meaningful.
Whether the study’s design supports the conclusion.
A confidence interval provides a range of values calculated using a particular statistical method. Its interpretation depends on the assumptions and procedure used to construct it.
Avoid treating an estimate as an exact value for an entire population. Instead, consider how precise the estimate is and what uncertainty remains.
10. Understand Statistical Significance and Practical Importance
Students often encounter the phrase “statistically significant” when reading research papers.
In a common hypothesis-testing framework, a statistically significant result means that the observed data would be sufficiently unusual under a specified null hypothesis, according to a chosen significance threshold and the assumptions of the test.
However, statistical significance does not automatically mean that a finding is important, large, reliable, or causal.
Example: A difference in study performance
Imagine that a study reports a small improvement in test scores after students use a new revision tool.
If the sample is very large, even a small difference may be statistically significant. But the practical importance of that difference depends on the size of the improvement, the cost of the tool, the study design, and the context.
When evaluating a reported result, ask:
How large is the observed effect?
Is the difference meaningful in real-world terms?
How precise is the estimate?
Were the methods appropriate?
Are there limitations or alternative explanations?
Do not use a p-value alone to judge the quality of research. A sound interpretation considers effect size, uncertainty, research design, and the broader evidence.
11. Practice the Complete Statistical Thinking Process
Statistical thinking is easier to develop when you treat it as a complete process rather than a collection of disconnected formulas.
  Answer the original question, explain the evidence, acknowledge uncertainty, and identify limitations.
</box>
</row> </box>
The process may require returning to an earlier stage. For example, data analysis may reveal that the original question was too broad or that an important variable was not measured.
This cycle is widely used in statistics education because it connects calculations with the questions they are intended to answer.
12. Use a Practical Example to Develop Statistical Thinking
Consider a student who wants to investigate whether the amount of time spent studying is associated with quiz performance.
The student asks ten classmates how many hours they studied for a quiz and records their scores out of 100.
The following fictional dataset illustrates how the student might reason about the results. It is not a real research finding.
Student
Study time (hours)
Quiz score
A
1
55
B
2
62
C
2
68
D
3
70
E
3
74
F
4
78
G
4
81
H
5
84
I
6
88
J
2
60
Step 1: Formulate the question
Is study time associated with quiz performance among these students?
This is a statistical question because study time and quiz scores vary across students.
Step 2: Examine the data
The student could create a scatter plot with study time on the horizontal axis and quiz score on the vertical axis.
The data generally suggests that students who reported more study time tended to have higher scores, although the relationship is not exact.
Step 3: Consider variation
Students who studied for two hours received scores of 62, 68, and 60. Even with similar study times, their scores differed.
This suggests that study duration is not the only factor associated with performance.
Step 4: Evaluate limitations
The sample contains only ten students from one group. The study time is self-reported, and other factors—such as prior knowledge, sleep, study quality, and quiz difficulty—were not controlled.
These limitations affect how confidently the student can interpret the result.
Step 5: Draw a careful conclusion
A reasonable conclusion would be:
In this small illustrative dataset, students reporting more study time generally had higher quiz scores. However, the data shows an association rather than proving that additional study time caused higher scores. A larger, more carefully designed study would be needed to investigate the relationship further.
This conclusion demonstrates statistical thinking because it describes the pattern, recognizes variation, and avoids claiming more than the evidence supports.
13. Build Statistical Thinking Through Everyday Study Activities
You do not need access to complicated datasets or advanced software to develop statistical reasoning. Small activities can help you practice the main concepts regularly.
Activity 1: Analyze your study habits
Record how much time you spend studying each subject over one or two weeks.
Calculate the mean and median study time, compare weekdays with weekends, and look for patterns.
Then ask whether the recorded hours accurately represent study quality. Time spent studying and learning achieved are related concepts, but they are not interchangeable.
Activity 2: Compare two datasets
Choose two small datasets, such as quiz scores from two practice tests.
Compare their means, ranges, and distributions. Ask whether the average alone describes the difference between the results.
Activity 3: Evaluate a headline
Find a news article or online post that makes a claim using statistics.
Identify the statistic, sample, source, and comparison. Check whether the headline accurately reflects the evidence presented.
Activity 4: Practice interpreting a graph
Choose a graph from a textbook or academic article.
Write down the main trend, two supporting observations, and one limitation or unanswered question.
Activity 5: Predict before calculating
Before working out an average or creating a graph, predict what you expect to find. Then analyze the data and compare your prediction with the result.
This encourages you to think about the meaning of the information rather than focusing only on the mechanics of calculation.
14. Use Technology to Explore Data
Digital tools can make statistical concepts easier to explore by helping students organize data, create visualizations, and compare results.
Useful options include:
Spreadsheets: Microsoft Excel and Google Sheets can calculate averages, organize datasets, and produce charts.
Statistical software: R, Python, SPSS, and similar tools support more advanced analysis, depending on the course and research needs.
Online learning resources: Educational courses and tutorials can help explain probability, sampling, distributions, and statistical inference.
Data repositories: Public datasets provide opportunities to practice analyzing real information.
Technology should support your reasoning rather than replace it.
Before running a calculation, understand what question you are asking and why the chosen method is appropriate. After receiving a result, interpret it in plain language and check whether the conclusion makes sense in context.
For example, a spreadsheet can calculate a mean accurately, but it cannot automatically determine whether the sample was biased or whether the mean is the most informative summary.
15. Common Mistakes That Weaken Statistical Thinking
Developing statistical thinking involves learning what not to do as well as learning the correct techniques.
Mistake 1: Treating every statistic as equally informative
A mean, median, percentage, or correlation coefficient answers a particular type of question. The right statistic depends on the data and the purpose of the analysis.
Improve it: Ask what the statistic measures and whether it is appropriate for the question.
Mistake 2: Ignoring variation
Two groups can have the same average but very different distributions.
Improve it: Examine the spread and shape of the data, not just its center.
Mistake 3: Assuming a large sample is always representative
A large sample can still be biased if participants were selected in a way that systematically excludes important groups.
Improve it: Evaluate how the sample was collected, not only how many people participated.
Mistake 4: Confusing correlation with causation
An association between variables does not automatically identify the cause of an outcome.
Improve it: Consider alternative explanations and the research design.
Mistake 5: Ignoring uncertainty
Estimates from samples are not exact descriptions of entire populations.
Improve it: Look for confidence intervals, standard errors, sampling limitations, and other relevant measures of uncertainty.
Mistake 6: Focusing only on statistical significance
A statistically significant result may still be small or practically unimportant.
Improve it: Consider effect size, context, uncertainty, and the quality of the evidence.
Mistake 7: Drawing conclusions that go beyond the data
A study of one class may not support a conclusion about every student in every university.
Improve it: Match the strength and scope of your conclusion to the population, sample, and methods actually studied.
16. A Simple Weekly Plan to Improve Statistical Thinking
Consistent practice is more effective than trying to master every concept in one session. Use this one-week plan as a starting point.
Day
Practice task
Main skill
Monday
Write three statistical questions about student life
Asking questions
Tuesday
Collect a small, clearly defined dataset
Data collection
Wednesday
Calculate the mean, median, and range
Summarizing data
Thursday
Create a chart and describe the main pattern
Visualization
Friday
Identify possible bias or missing information
Critical evaluation
Saturday
Interpret a research claim or survey result
Evidence-based reasoning
Sunday
Write a short conclusion that includes a limitation
Statistical communication
Repeat the cycle with a different topic each week. As your confidence grows, explore sampling, probability, correlation, confidence intervals, and hypothesis testing.
The aim is to develop a habit of reasoning with data rather than simply completing isolated calculations.
Frequently Asked Questions
What is statistical thinking in simple terms?
Statistical thinking is the ability to ask questions about data, understand why observations differ, identify patterns, and draw conclusions that account for uncertainty. It helps you interpret numbers in context instead of accepting them at face value.
How can students develop statistical thinking?
Students can develop statistical thinking by practicing data collection, comparing distributions, interpreting graphs, evaluating surveys, and questioning research claims. Focus on understanding what each statistic means and whether the evidence supports the conclusion.
Why is statistical thinking important in academic research?
Academic research frequently involves samples, variable measurements, uncertain estimates, and comparisons. Statistical thinking helps researchers and students choose appropriate methods, recognize limitations, interpret findings, and communicate conclusions responsibly.
What is the difference between statistical thinking and statistical calculation?
Statistical calculation involves carrying out numerical procedures, such as calculating a mean or standard deviation. Statistical thinking involves deciding which calculation is appropriate, interpreting the result, understanding the data’s limitations, and using the evidence to answer a question.
Do I need advanced mathematics to think statistically?
No. Many important statistical thinking skills begin with asking good questions, comparing values, understanding variation, and evaluating evidence. Advanced mathematics becomes useful for more complex analyses, but the core habits can be developed with simple datasets.
How does statistical thinking help with research papers?
It helps you evaluate how participants were selected, how variables were measured, whether the analysis is appropriate, and what conclusions the results support. It also helps you distinguish association from causation and recognize uncertainty.
What is the most important concept in statistical thinking?
There is no single concept that answers every statistical question, but understanding variation is fundamental. Data values differ, samples produce different estimates, and results are affected by the way information is collected and analyzed.
How often should students practice statistical thinking?
Short, regular practice is a useful approach. Interpreting one graph, evaluating one statistical claim, or analyzing a small dataset several times each week can gradually strengthen your reasoning skills.
Conclusion
Developing statistical thinking for students is about learning to reason carefully with evidence. It requires more than calculating averages or memorizing formulas. You need to ask meaningful questions, understand variation, evaluate samples, recognize bias, distinguish correlation from causation, and consider uncertainty when interpreting results.
These skills can make academic research easier to understand and help you become a more confident reader of statistics in textbooks, scientific papers, and everyday information.
Start with small datasets, practice interpreting graphs, and question the assumptions behind statistical claims. Over time, you will become better at identifying meaningful patterns, recognizing weak evidence, and drawing conclusions that reflect what the data actually shows.
The key principle is simple: do not just ask what the numbers say—ask how they were produced, what they mean, and how confidently they support the conclusion
The scientific method is a systematic way to investigate questions, test possible explanations, and use evidence to understand how the world works. Students use it in science classes, laboratory experiments, research projects, and everyday problem-solving. Whether you are studying biology, chemistry, physics, or environmental science, understanding the scientific method can help you think critically and reach evidence-based conclusions.
Learning the scientific method steps for students makes scientific investigations easier to plan, conduct, and explain. Instead of guessing an answer, you learn how to make observations, ask testable questions, develop a hypothesis, collect data, and evaluate the results.
In this guide, you will discover the main steps of the scientific method, learn how to apply them through practical examples, understand variables and fair testing, and explore common mistakes to avoid in school experiments.
What Is the Scientific Method?
The scientific method is an organized process for investigating questions about the natural world. It involves making observations, developing possible explanations, testing predictions, analyzing evidence, and communicating findings.
Scientists use this process to investigate everything from plant growth and chemical reactions to weather patterns and human behavior. Students can use the same principles to design classroom experiments and complete science projects.
The scientific method is not always a rigid sequence of steps. Researchers may repeat an experiment, revise a hypothesis, gather additional information, or ask a new question when the evidence does not match their expectations. The central principle is that scientific explanations should be evaluated using evidence rather than personal opinions or assumptions.
Why Is the Scientific Method Important for Students?
Learning the scientific method helps students develop skills that are useful both inside and outside the classroom.
Critical thinking: You learn to evaluate explanations and distinguish evidence from assumptions.
Problem-solving: You develop a structured approach to investigating unfamiliar questions.
Observation skills: You learn to notice patterns, measure changes, and record details accurately.
Data analysis: You practice organizing results, comparing measurements, and identifying trends.
Research skills: You learn to find reliable background information and develop focused questions.
Scientific communication: You gain experience explaining methods, results, and conclusions clearly.
Academic independence: You become more confident in investigating questions instead of relying entirely on ready-made answers.
These skills can support school assignments, laboratory reports, science fairs, university research, and future professional work.
The 7 Scientific Method Steps for Students
Different textbooks describe the scientific method using five, six, seven, or more steps. The exact labels may vary, but the main process is similar: ask a question, investigate it systematically, evaluate the evidence, and communicate what you learn.
Here are seven practical steps students can follow.
Step 1: Make an Observation
Every scientific investigation begins with something you notice. An observation may involve a pattern, an unexpected result, a change, or a question about how something works.
For example, you might notice that a plant beside a sunny window appears taller than a similar plant in a darker corner. This observation could lead you to investigate whether the amount of light affects plant growth.
Observations can be qualitative or quantitative.
Qualitative observations describe qualities or characteristics, such as color, texture, or appearance.
Quantitative observations involve numerical measurements, such as height, temperature, mass, or time.
Both types can be useful, but numerical measurements often make it easier to compare results systematically.
Student tip: Record what you actually observe before deciding why it happened. Keeping observations separate from explanations helps reduce bias.
Step 2: Ask a Testable Question
After making an observation, turn your curiosity into a focused question that can be investigated.
A good scientific question should be clear, specific, and answerable through observations, measurements, or an appropriate experiment.
For example:
Broad question: Why do plants grow differently?
More focused question: Does the amount of daily light affect the height of bean plants?
Another example: Does water temperature affect how quickly sugar dissolves?
The more specific question makes it easier to identify what information you need to collect.
Before moving forward, consider whether you have the time, equipment, materials, and permission needed to investigate the question safely. Some scientific questions cannot be tested through a simple classroom experiment and may require observational research instead.
Step 3: Research the Topic
Before developing a hypothesis, find out what is already known about your question.
Useful sources include science textbooks, educational websites, reliable reference materials, and relevant scientific publications. Background research helps you understand the concepts involved and avoid repeating mistakes that others have already identified.
During this stage, ask:
What do scientists already know about this topic?
Which scientific principles may explain the observation?
How have similar questions been investigated?
What measurements or equipment might be needed?
What safety precautions should be followed?
For example, if you are studying how temperature affects the dissolving of sugar, research how temperature influences the movement of particles and the rate at which substances dissolve.
Record important information and keep track of your sources if you are preparing a formal project. Background research should help you develop a better investigation, not simply provide an answer to copy.
Step 4: Form a Hypothesis
A hypothesis is a testable proposed explanation or prediction about what may happen during an investigation. It should be based on observations and relevant background knowledge.
A useful hypothesis identifies an expected relationship between variables and can be evaluated using evidence.
One common structure is:
If a particular condition changes, then a measurable outcome will change, because of a scientific reason.
For example:
If the temperature of water increases, then a fixed amount of sugar will dissolve in less time because particles move more rapidly at higher temperatures.
This hypothesis identifies the condition being changed, the outcome being measured, and a possible scientific explanation.
A hypothesis does not need to be correct to be useful. Its purpose is to guide a test that can produce evidence for evaluating the proposed explanation.
Avoid statements that cannot be tested. For example, “Plants grow better when they feel happy” is difficult to investigate scientifically unless you define measurable conditions and outcomes.
Step 5: Design and Conduct an Experiment
Once you have a hypothesis, plan an investigation that can test it fairly.
Start by listing the materials, equipment, procedure, variables, and safety precautions. Write the steps clearly enough that another student could repeat the experiment under similar conditions.
A well-designed experiment should specify:
What you will change.
What you will measure.
Which conditions you will keep constant.
How you will record the results.
How many trials you will conduct.
What safety measures are required.
When possible, change one main independent variable at a time while keeping other important conditions consistent. This helps you determine whether the observed change is associated with the variable you intended to test.
Not every scientific investigation is a controlled experiment. Some questions are better investigated through field observations, surveys, or analysis of existing data. The method should suit the question.
Step 6: Collect and Analyze Data
During the investigation, record results accurately and consistently. Do not rely on memory or record only the observations that seem to support your hypothesis.
Depending on the experiment, your data may include measurements, counts, descriptions, photographs, or other relevant observations.
A data table can help organize your findings. After collecting the data, look for patterns, calculate differences or averages when appropriate, and consider whether any unusual results need further investigation.
For example, if you measure the time sugar takes to dissolve at several water temperatures, you could calculate the average time for repeated trials at each temperature and compare the averages.
Graphs can also make patterns easier to recognize. A line graph may help show how a measurement changes as temperature increases, while a bar chart may be useful for comparing separate groups.
When analyzing results, ask:
What pattern appears in the data?
Which condition produced the highest or lowest measurement?
Were the results consistent across trials?
Were there any unexpected observations?
Could measurement errors or uncontrolled factors have affected the results?
Step 7: Draw a Conclusion and Communicate Results
The final step is to answer the original research question using the evidence you collected.
A strong conclusion should summarize the main results, explain whether they support the hypothesis, and acknowledge any important limitations.
For example:
In this investigation, sugar dissolved more quickly in warmer water under the tested conditions. The results support the hypothesis that increasing water temperature reduces the time needed for the sugar to dissolve. However, further trials would help determine how consistent the pattern is.
Notice that the conclusion refers to the observed results rather than claiming the hypothesis has been permanently proven.
You should also consider whether the experiment could be improved. Perhaps the temperature was difficult to maintain, the amount of sugar varied between trials, or additional measurements would provide more reliable evidence.
Finally, communicate your work through a laboratory report, research poster, class presentation, or science project. Include enough detail for readers to understand the question, method, evidence, and conclusion.
If your findings do not support the hypothesis, that is still a useful scientific outcome. You can revise the hypothesis, improve the procedure, or design a new investigation.
A Practical Example of the Scientific Method
The easiest way to understand the scientific method is to see how the steps work together in a complete investigation.
Consider this student experiment: Does water temperature affect how quickly sugar dissolves?
The following data is illustrative and is included to demonstrate how students might organize and interpret experimental results. It is not presented as a real laboratory measurement.
Step 1: Observation
A student notices that sugar seems to dissolve faster in a warm drink than in a cold drink.
Step 2: Research question
Does water temperature affect the time required for a fixed amount of sugar to dissolve?
Step 3: Background research
The student reviews basic information about temperature, particle movement, and dissolving. The student also considers how to keep the test fair.
Step 4: Hypothesis
If water temperature increases, then sugar will dissolve in less time because particles move more rapidly at higher temperatures.
Step 5: Experiment
The student prepares three containers with equal amounts of water at different temperatures. The same mass of sugar is added to each container, and each sample is stirred using the same procedure.
The student records how long the sugar takes to dissolve and repeats the trials under the same conditions.
For safety, use appropriate equipment and adult or teacher supervision when handling hot water.
Step 6: Record and analyze the data
Suppose the student obtains the following illustrative average results:
Water temperature
Average dissolving time
10°C
120 seconds
25°C
75 seconds
40°C
45 seconds
The table shows that the average dissolving time decreases as the water temperature increases.
The difference between the measurements at 10°C and 40°C is:
120 − 45 = 75 seconds.
In this example, the sugar dissolved 75 seconds faster in the warmest water than in the coldest water.
Step 7: Conclusion
The illustrative results support the hypothesis that sugar dissolves more quickly in warmer water under the tested conditions. However, the student should consider the number of trials, measurement accuracy, and whether stirring and other conditions remained consistent.
A more complete investigation could use additional trials and more temperature levels to determine whether the pattern remains consistent.
What does this example teach us?
The scientific method connects a question with a systematic test and an evidence-based conclusion. Each step contributes to the quality of the investigation.
A good hypothesis alone is not enough. The procedure must be appropriate, the measurements must be reliable, and the final conclusion must reflect what the evidence actually shows.
Understanding Variables in the Scientific Method
Variables are factors or characteristics that can change during an investigation. Understanding them is essential for designing a fair experiment.
Three important types of variables are the independent variable, dependent variable, and controlled variables.
Variable type
Meaning
Sugar experiment example
Independent variable
The factor deliberately changed
Water temperature
Dependent variable
The outcome measured
Time taken for sugar to dissolve
Controlled variables
Other relevant conditions kept consistent
Amount of sugar, volume of water, stirring procedure, and container type
Independent variable
The independent variable is the factor the investigator deliberately changes to examine its effect.
In the sugar experiment, the independent variable is water temperature.
Dependent variable
The dependent variable is the outcome measured during the experiment.
In this example, it is the time required for the sugar to dissolve completely.
Controlled variables
Controlled variables are conditions kept as consistent as possible so that the experiment provides a fair comparison.
For example, using different amounts of sugar would make it harder to determine whether temperature alone explains the difference in dissolving time.
A controlled variable is not necessarily the same as a control group. A control group is a comparison group used in certain experimental designs, while controlled variables are conditions maintained consistently across the investigation.
How to Write a Strong Scientific Hypothesis
Students sometimes struggle to distinguish a hypothesis from a question or a conclusion.
A research question identifies what you want to investigate. A hypothesis predicts a possible answer before the results are known. A conclusion explains what the collected evidence indicates after the investigation.
For example:
Research question: Does the amount of light affect bean plant growth?
Hypothesis: Bean plants receiving more daily light will grow taller over two weeks than similar plants receiving less daily light, provided their other growing conditions remain comparable.
Conclusion: The recorded measurements showed whether the plants differed in height under the tested light conditions.
A useful hypothesis should be:
Testable: You can investigate it through observations or measurements.
Specific: It identifies the variables or conditions being studied.
Measurable: It predicts an outcome that can be evaluated.
Evidence-based: It draws on observations or relevant background knowledge.
A hypothesis should also be open to being contradicted by evidence. If no possible result could count against the statement, it may not be suitable for a scientific test.
Scientific Method vs. Scientific Theory
Students often confuse a hypothesis with a scientific theory. Although both are related to scientific explanations, they serve different purposes.
A hypothesis is a specific, testable proposed explanation or prediction. It guides an investigation and can be evaluated against evidence.
A scientific theory is a broad explanatory framework supported by extensive evidence from multiple investigations. Scientific theories explain many observations and can generate further predictions.
For example, a student may develop a hypothesis about how temperature affects dissolving time. That hypothesis is a specific prediction to test. It is not a scientific theory.
Scientific theories are not simply guesses that have become popular. They are well-supported explanations that can be refined as new evidence emerges.
Common Mistakes Students Should Avoid
Even a simple experiment can produce misleading results if the scientific method is not applied carefully.
1. Writing a vague research question
A question such as “How do plants grow?” is too broad for many school experiments.
How to improve it: Focus on a measurable relationship, such as how daily light exposure affects the height of a particular plant over a defined period.
2. Confusing a hypothesis with a fact
A hypothesis is a proposed explanation or prediction, not a result that has already been established.
How to improve it: Write your prediction before conducting the experiment and remain open to different outcomes.
3. Changing several variables at once
If you change water temperature, the amount of sugar, and the stirring speed simultaneously, you may not know which factor caused the difference in results.
How to improve it: Keep important conditions consistent and deliberately change the main variable you intend to investigate.
4. Recording only favorable results
Ignoring unexpected results can introduce bias and make the conclusion unreliable.
How to improve it: Record all relevant observations, including results that do not match your expectations.
5. Drawing conclusions from too little evidence
A single measurement may be affected by chance or measurement error.
How to improve it: Repeat trials when practical, compare results, and acknowledge limitations.
6. Claiming that a hypothesis has been proven
One experiment rarely establishes a universal explanation. Results may depend on the tested conditions, measurement quality, and experimental design.
How to improve it: Explain whether the evidence supports the hypothesis under the conditions tested.
7. Ignoring safety precautions
Some experiments involve heat, chemicals, electrical equipment, biological materials, or other hazards.
How to improve it: Follow teacher instructions, use appropriate protective equipment, and never conduct a potentially hazardous experiment without suitable supervision.
How to Use the Scientific Method in Different Subjects
The scientific method is useful across many fields, although the specific techniques vary according to the research question.
Biology
Students can investigate how environmental conditions relate to plant growth, how organisms respond to their surroundings, or how different conditions affect observable biological processes.
For example, a student might compare the growth of similar plants under different light conditions while keeping water, soil, and other relevant factors consistent.
Chemistry
Students can investigate reaction rates, dissolving, acidity, or changes in materials. Measurements should be recorded carefully, and all chemical procedures must follow classroom safety rules.
Physics
Students can explore relationships involving force, motion, energy, temperature, or electrical circuits. A well-designed investigation defines the variables and uses suitable measuring instruments.
Environmental science
Students can study patterns in rainfall, local biodiversity, water quality, or waste production. Some environmental questions are best investigated through repeated observations rather than controlled experiments.
Social science
Researchers may investigate human behavior, learning patterns, or survey responses using questionnaires, interviews, observations, and statistical analysis. Ethical considerations, privacy, and the limitations of the sample are particularly important.
Across all these subjects, the same basic principle applies: formulate a clear question, gather appropriate evidence, analyze it carefully, and communicate conclusions honestly.
How to Present a Scientific Method Project
After completing an investigation, students often need to explain their work in a written report or class presentation.
A clear project usually includes the following sections:
Title: A short description of the investigation.
Research question: The question the project investigates.
Background information: Relevant scientific concepts and previous findings.
Hypothesis: The predicted outcome and, where appropriate, its scientific reasoning.
Materials: The equipment and supplies used.
Method: The procedure followed, including variables and safety measures.
Results: Measurements, observations, tables, and graphs.
Discussion: An interpretation of the findings, including patterns and limitations.
Conclusion: A direct answer to the research question based on the evidence.
References: The sources used for background research.
Keep the results separate from the interpretation where appropriate. The results section reports what you observed, while the discussion explains what the results may mean.
For a more detailed guide, read
Tips for Making Your Scientific Investigation More Reliable
Good scientific work depends not only on following steps but also on the quality of the evidence.
Use these practices to improve your investigation:
Plan the procedure before collecting data.
Use suitable measuring instruments.
Keep measurement methods consistent.
Repeat trials when practical.
Record units and relevant conditions.
Avoid changing the procedure without documenting the change.
Distinguish observations from interpretations.
Identify possible sources of error.
Explain limitations honestly.
Suggest improvements for future investigations.
Reliability and validity are related but different. Reliability concerns the consistency of measurements or results, while validity concerns whether the investigation appropriately tests the question it is intended to answer.
A study can produce consistent measurements and still fail to answer its research question if it measures the wrong outcome or does not control important factors.
Frequently Asked Questions About the Scientific Method
What are the 7 steps of the scientific method?
A student-friendly version includes making an observation, asking a question, researching the topic, forming a hypothesis, designing and conducting an experiment, collecting and analyzing data, and drawing a conclusion. Students should also communicate their findings and revise their investigation when needed.
What is the scientific method in simple words?
The scientific method is a way to answer questions using observations, testing, and evidence. Instead of relying on guesses alone, you investigate a question systematically and use your results to decide what the evidence supports.
What is an example of the scientific method?
A student notices that sugar dissolves faster in warm water than in cold water. The student asks whether temperature affects dissolving time, develops a hypothesis, tests equal amounts of sugar in water at different temperatures, records the results, compares the measurements, and draws a conclusion based on the data.
What is the difference between a hypothesis and a conclusion?
A hypothesis is a testable prediction made before an investigation. A conclusion is an evidence-based statement written after the results have been analyzed. The conclusion explains whether the findings support the hypothesis under the conditions tested.
Does the hypothesis have to be correct?
No. A hypothesis does not need to be correct to make an investigation useful. Results that contradict a prediction can help students reject or revise an explanation and develop a better question.
Why should students repeat an experiment?
Repeated trials help students determine whether a result is consistent or may have occurred by chance or measurement error. Repetition does not eliminate every source of error, but it can improve confidence in the observed pattern.
Is the scientific method always performed in the same order?
No. The steps provide a useful framework, but scientific investigations are often iterative. Researchers may return to earlier steps, revise hypotheses, collect additional data, or ask new questions as they learn more.
What is the difference between a control group and a controlled variable?
A control group is a comparison group used in certain experiments. A controlled variable is a condition that is kept consistent to make comparisons more meaningful. Some experiments use both, but they are not interchangeable terms.
Conclusion
Understanding the scientific method helps students investigate questions logically, collect useful evidence, and explain their findings clearly. The main scientific method steps for students are to make observations, ask a testable question, research the topic, develop a hypothesis, conduct a suitable investigation, analyze the data, and draw a conclusion.
Remember that good science is not about getting the expected answer every time. It is about asking clear questions, testing ideas fairly, recording results honestly, and changing your explanation when the evidence requires it.
With practice, students can use the scientific method to complete stronger laboratory reports, develop more effective research projects, and build critical-thinking skills that extend far beyond the science classroom.
Charts, graphs, and tables are common features of textbooks, lecture notes, research papers, and study guides. They help explain complicated ideas, summarize large amounts of information, and show relationships that may be difficult to understand through text alone. However, simply looking at a visual representation of data is not the same as understanding what it means.
Learning how to interpret charts and graphs is an important academic skill. It helps students identify patterns, compare values, understand scientific results, and answer questions accurately in exams and assignments. The same skill is useful in subjects such as mathematics, biology, economics, geography, physics, and social sciences.
In this guide, you will learn how to read charts, graphs, and tables step by step, recognize common mistakes, evaluate the information presented, and use visual data more effectively when studying.
Why Is It Important to Interpret Charts, Graphs, and Tables?
Textbooks often use visual information to communicate ideas efficiently. A graph may show how a population changes over time, a table may compare experimental results, and a chart may summarize the distribution of a particular set of values.
Understanding these representations helps you:
Understand complex information: Visuals can make relationships and patterns easier to recognize.
Identify important trends: Graphs can reveal increases, decreases, fluctuations, and periods of stability.
Compare information accurately: Tables and charts allow you to compare groups, categories, or measurements.
Improve exam performance: Questions frequently ask students to describe trends, calculate differences, or draw conclusions from data.
Strengthen critical thinking: Careful interpretation helps you recognize misleading scales, incomplete information, and unsupported conclusions.
Remember key concepts: Connecting a visual representation with its meaning can make revision more active and purposeful.
The goal is not to memorize every number. Instead, you should understand what the data represents, what patterns it reveals, and what conclusions the evidence supports.
1. Start by Understanding the Title and Context
Before examining individual values, read the title and surrounding textbook text. These provide the context needed to interpret the visual correctly.
Ask yourself three questions:
What topic is being discussed?
What information does the chart, graph, or table present?
What question is the visual intended to answer?
For example, a graph titled Average Monthly Rainfall in Three Cities tells you that the information concerns rainfall, compares three locations, and covers multiple months.
However, the title alone may not tell you whether rainfall is measured in millimeters or inches, whether the figures represent averages over one year or several decades, or whether the data is observed or estimated. You must check the labels and notes to understand those details.
Study tip: Read the paragraph immediately before or after the visual. Textbook authors often explain why the information matters or connect it to a concept introduced in the chapter.
2. Identify the Type of Visual Representation
Different types of charts, graphs, and tables are designed for different purposes. Recognizing the format helps you decide what to look for.
Type
Main purpose
What to examine
Bar chart
Compare categories or groups
Differences in bar height or length
Line graph
Show changes across time or another ordered variable
Direction, trends, peaks, and fluctuations
Pie chart
Show parts of a whole
Proportions and percentages
Histogram
Show the distribution of numerical data
Frequency, concentration, and spread
Data table
Organize exact values
Row and column headings, units, and comparisons
Scatter plot
Show the relationship between two numerical variables
Association, clusters, and outliers
Diagram
Explain a structure or process
Labels, arrows, sequence, and connections
For example, a bar chart comparing average exam scores across five classes is useful for identifying which class has the highest or lowest score. A line graph showing average scores over several months is more suitable for understanding how performance changes over time.
Choosing the right interpretation method begins with recognizing what the visual is designed to communicate.
3. How to Interpret Charts and Graphs Step by Step
When learning how to interpret charts and graphs, follow a consistent reading process rather than immediately jumping to conclusions.
Step 1: Read the title carefully
Determine the main subject and purpose of the visual. Rephrase the title in your own words to check your understanding.
Step 2: Examine the axes
In most standard graphs, the horizontal axis is called the x-axis, while the vertical axis is called the y-axis.
Check what each axis represents. One may show time, distance, temperature, or categories, while the other displays a measured quantity.
Never assume that the axes follow a familiar pattern. Always read their labels.
Step 3: Check the units and scale
Look for units such as kilograms, centimeters, degrees Celsius, percentages, or dollars.
Then examine the scale. Does it increase by 1, 5, 10, or 100 units? Does it start at zero, or does it begin at another value?
A scale that begins above zero can make small differences appear much larger than they are. Understanding the scale prevents you from misjudging the size of a change.
Step 4: Read the legend or key
If the graph contains several lines, colors, symbols, or patterns, use the legend to identify what each one represents.
For example, a line graph may use one line for boys and another for girls. Without checking the legend, you could easily assign the wrong meaning to a trend.
Step 5: Identify the overall pattern
Look at the visual as a whole before focusing on individual values.
Ask whether the data generally increases, decreases, remains stable, fluctuates, or shows differences between categories.
Step 6: Examine important details
After identifying the general pattern, look for the highest and lowest values, sudden changes, unusual observations, and important comparisons.
Use exact figures when the question requires them.
Step 7: Summarize the meaning
Explain the main finding in one or two sentences. Your summary should identify the pattern and support it with evidence from the visual.
For example:
The graph shows that average plant height increased throughout the four-week experiment, rising from 4 cm in the first week to 15 cm in the fourth week.
This is more informative than saying, “The graph goes up,” because it identifies the subject, the trend, and the relevant values.
4. How to Read a Bar Chart
Bar charts use rectangular bars to compare values across categories. The bars may be vertical or horizontal, depending on how the information is presented.
To interpret a bar chart:
Read the category labels.
Check what the numerical axis measures.
Compare the heights or lengths of the bars.
Identify the highest and lowest categories.
Calculate differences if necessary.
Consider whether the differences are meaningful in context.
Example: Comparing students’ preferred study methods
Suppose a textbook presents the following fictional survey results:
Study method
Number of students
Reading notes
18
Practice questions
30
Group study
12
Video lessons
24
The largest value is 30, so practice questions were the most commonly selected method. Group study had the smallest value, at 12 students.
The difference between practice questions and group study is:
30 − 12 = 18 students.
A useful interpretation would be:
Practice questions were selected by 18 more students than group study, making them the most popular option in this survey.
Notice that the conclusion is limited to the survey results. It does not prove that practice questions are the most effective method for every student.
5. How to Interpret a Line Graph
Line graphs are often used to show how a variable changes over time or across an ordered sequence. They are common in science, economics, geography, and mathematics.
When reading a line graph, examine:
Direction: Is the line moving upward, downward, or remaining level?
Rate of change: Does the value change gradually or rapidly?
Peaks: Where does the variable reach its highest value?
Troughs: Where does it reach its lowest value?
Fluctuations: Does the line repeatedly rise and fall?
Comparisons: If there are multiple lines, how do their patterns differ?
Example: Understanding plant growth
Imagine a line graph showing the height of a plant during a four-week experiment.
Week
Plant height
1
4 cm
2
7 cm
3
11 cm
4
15 cm
The plant grows throughout the observation period. Its height increases by 3 cm between weeks one and two, 4 cm between weeks two and three, and 4 cm between weeks three and four.
The total increase is:
15 − 4 = 11 cm.
A complete interpretation might be:
The plant’s height increased from 4 cm to 15 cm over four weeks, a total gain of 11 cm. Growth was greater in the second and third intervals than in the first interval.
The data shows the pattern of growth, but it does not establish what caused that growth. To explain the cause, you would need additional information about the experiment, such as watering, light exposure, temperature, and the presence of a comparison group.
6. How to Read a Pie Chart
A pie chart represents a whole divided into sections. Each section shows the proportion associated with a category.
Pie charts are often used for survey results, budget breakdowns, population composition, and other data that can be expressed as parts of a total.
When interpreting a pie chart:
Identify what the entire circle represents.
Read the category names.
Check whether the sections are labeled with percentages, fractions, or values.
Compare the sizes of the sections.
Identify the largest and smallest proportions.
Confirm that the categories and percentages make sense for the stated total.
If a pie chart represents 100% of a group, all its sections should add up to 100%, allowing for rounding.
Example: Time spent studying
Suppose a student divides a weekly study schedule as follows:
Reading: 40%
Practice questions: 30%
Reviewing notes: 20%
Group discussion: 10%
Reading accounts for the largest share of study time, while group discussion accounts for the smallest.
If the student spends 20 hours studying per week, reading takes:
40% × 20 = 8 hours.
The chart shows how the student’s time is distributed. It does not automatically show whether that schedule is effective or whether a different allocation would produce better results.
7. How to Interpret Tables in Textbooks
Tables present information in rows and columns. They are especially useful when readers need exact figures or must compare several variables at once.
Unlike graphs, tables often allow you to locate precise values without estimating from a scale.
Use the following approach:
Read the table title
Identify the subject, population, location, or period covered by the data.
Understand the row and column headings
Row headings usually identify categories or observations, while column headings describe the variables being compared. However, the structure may vary, so read both carefully.
Check units and footnotes
A table may report values in thousands, millions, percentages, or specific measurement units. Footnotes may explain abbreviations, missing values, rounding, or exceptions.
Locate the relevant values
If the question asks for one specific result, find the appropriate row and column and trace them to their intersection.
Compare values systematically
Compare values within the same category or across the same variable. Avoid comparing numbers that represent different units or different types of measurement.
Look for patterns and exceptions
Determine which values are largest or smallest, whether the numbers change consistently, and whether any observation differs noticeably from the others.
Example: Comparing examination results
Consider this fictional table:
Subject
Class A average
Class B average
Mathematics
76
82
Biology
84
79
History
72
75
The table shows that Class B has a higher average in mathematics and history, while Class A has a higher average in biology.
The difference in mathematics is:
82 − 76 = 6 points.
A suitable summary is:
Class B recorded a mathematics average six points higher than Class A, while Class A performed five points higher in biology. The results vary by subject rather than showing one class leading in every category.
This summary compares the values accurately without making a broader claim about overall academic ability.
8. How to Recognize Trends, Patterns, and Relationships
Identifying a pattern is one of the most important parts of interpreting visual data. A pattern describes how values behave across categories, measurements, or time.
Common patterns include:
Increasing trend: Values generally rise.
Decreasing trend: Values generally fall.
Stable pattern: Values remain approximately the same.
Fluctuating pattern: Values rise and fall.
Positive association: Two variables tend to increase together.
Negative association: One variable tends to decrease as the other increases.
No clear association: The data does not show an obvious consistent relationship.
Be precise when describing patterns. A line may rise overall even if it contains a few downward movements. Similarly, two variables may have a positive association without one directly causing the other.
For example, a graph might show that students who spend more time practicing questions tend to achieve higher scores. This suggests an association, but the graph alone cannot prove that practice time is the only cause. Prior knowledge, study quality, and other factors may also affect results.
Important: Describe what the data demonstrates before explaining why the pattern might exist.
9. How to Compare Data Accurately
Textbook questions often ask you to compare groups, identify differences, or calculate percentage changes.
Use the method that matches the wording of the question.
Finding an absolute difference
Subtract the smaller value from the larger value.
For example, if one group scores 85 and another scores 70:
85 − 70 = 15 points.
Calculating percentage change
Use this formula:
Percentage change = ((New value − Original value) ÷ Original value) × 100
For example, if a measurement increases from 50 to 60:
((60 − 50) ÷ 50) × 100 = 20%
The measurement increased by 20%.
Distinguishing percentages from percentage points
Suppose a pass rate rises from 40% to 50%.
The increase is 10 percentage points. Relative to the original 40% rate, the increase is 25%.
These expressions are not interchangeable, so use the wording that accurately describes the calculation.
Comparing values on different scales
If two graphs use different units or scales, check whether their values can be compared directly. A difference of 10 degrees is not the same kind of quantity as a difference of 10 centimeters.
For exam questions, show the calculation when appropriate and include units in the final answer.
10. How to Interpret Graphs Critically and Avoid Misleading Conclusions
Not every chart communicates information clearly. Some visuals can create misleading impressions because of the way the data is selected, scaled, labeled, or presented.
Develop the habit of checking the following details.
A truncated vertical axis
A graph that begins at a value above zero may exaggerate apparent differences between groups. Read the axis carefully before judging the size of a difference.
Unequal intervals
Check whether intervals on an axis are consistent. Unequal intervals displayed as if they were equal can distort the apparent relationship between values.
Missing labels or units
Without labels and units, it may be impossible to determine what a number represents. Look for captions, footnotes, and explanatory text.
Selective data
A graph may display only part of a time period or omit relevant comparison groups. Ask whether the information shown is sufficient to support the stated conclusion.
Confusing correlation with causation
Two variables may change together without one causing the other. Additional evidence is needed to establish a causal relationship.
Small differences presented as major findings
A visual may make a small numerical difference look dramatic. Compare the actual values, the scale, the sample size, and the uncertainty where available.
Missing sample sizes or context
A percentage based on 20 observations may have a different level of reliability from the same percentage based on 20,000 observations. Consider the source, sample, date, and method of data collection when these details are provided.
A useful rule is to ask: Does the conclusion follow from the data, or does it go beyond what the visual can prove?
11. How to Use Charts and Graphs Effectively When Studying
Reading a graph once may help you understand the topic, but actively working with the information can make your study session more productive.
Use the cover-and-recall method
Study the chart, then cover it and explain the main finding from memory. Reopen it to check whether your explanation was accurate.
Write a one-sentence summary
For each important visual, write one sentence that captures its main message. Include a specific value or comparison when relevant.
Create questions from the data
Turn the visual into practice questions, such as:
Which category has the highest value?
How much did the measurement change?
What trend is visible?
Which two groups differ most?
What conclusion is supported by the evidence?
What additional information would help explain the pattern?
Connect the visual to the textbook explanation
Ask how the graph or table supports the chapter’s main concept. This helps you understand the reason the author included it.
Record important figures with their meaning
Instead of copying a list of numbers into your notes, record the most important values and what they demonstrate. For example, write, “The reaction rate increased as temperature rose within the tested range,” if that is what the data supports.
For more effective revision, combine this approach with . Replace the example link with the URL of a relevant study-skills article on your website.
12. How to Answer Exam Questions About Charts, Graphs, and Tables
When answering questions based on visual data, pay attention to the instruction word. Different verbs require different kinds of answers.
Instruction word
What to do
Identify
Name the required value, category, or feature.
Describe
Explain the visible pattern or trend.
Compare
State similarities or differences using evidence.
Calculate
Perform the required mathematical operation and show working when needed.
Explain
Give a reason or mechanism supported by the available information.
Evaluate
Assess the evidence, limitations, and strength of the conclusion.
Predict
Suggest a likely outcome based on the observed pattern, while recognizing uncertainty.
A simple structure for descriptive answers
A strong response often includes three parts:
Main finding: State the overall pattern.
Evidence: Include one or two relevant figures or comparisons.
Interpretation: Explain what the pattern means in the context of the question.
For example:
The measured temperature increased during the first three hours, rising from 20°C to 35°C. It then remained close to 35°C during the final hour. This indicates that the temperature rose initially before stabilizing during the observation period.
Do not add an explanation of the cause unless the question provides enough evidence to support it.
13. Common Mistakes Students Make When Reading Visual Data
Even students who understand the subject can misinterpret visual information when they overlook small details.
Avoid these common errors:
Ignoring the title: You may misunderstand the topic or time period.
Skipping axis labels: You may assign the wrong meaning to the values.
Forgetting units: A numerical answer without the correct unit may be incomplete.
Reading only the highest value: The overall pattern may be more important than a single observation.
Confusing a count with a percentage: These measurements represent different things.
Treating an estimate as an exact value: Values read from a graph may be approximate.
Assuming a trend proves causation: A relationship does not necessarily explain why something happened.
Overgeneralizing: Results from a limited sample may not apply to every population.
Ignoring footnotes: Important qualifications may appear below the visual.
Describing without evidence: Support your answer with relevant figures whenever possible.
To improve, slow down and verify the title, labels, units, scale, and source before writing your conclusion.
14. A Quick Checklist for Interpreting Charts, Graphs, and Tables
Use this checklist whenever you encounter a visual in a textbook or assignment.
I understand the title and context.
I know what each axis, row, and column represents.
I have checked the units and scale.
I understand the legend, symbols, and abbreviations.
I have identified the main trend or comparison.
I have checked the highest and lowest values where relevant.
I have verified calculations and included units.
I have considered the source and limitations of the data.
My conclusion is supported by the information shown.
I can summarize the main message in my own words.
You do not need to write out every item for every graph. Use the checklist as a mental routine until the process becomes familiar.
Frequently Asked Questions
What is the easiest way to interpret charts and graphs?
Start with the title, then read the axis labels, units, scale, and legend. Identify the overall pattern, examine important values, and summarize what the data shows in your own words. This step-by-step method reduces the risk of misreading the information.
What is the difference between a chart and a graph?
The terms often overlap in everyday use. Generally, charts present information visually to make comparisons or relationships easier to understand, while graphs commonly display numerical relationships or changes in variables. Bar charts, line graphs, and scatter plots are examples of visual data representations.
How do you interpret a graph in a textbook?
Read the title and surrounding text, determine what the axes represent, check the units and scale, and identify the trend. Then support your interpretation with specific values or comparisons and explain what the pattern means in context.
How do you interpret a table correctly?
Read the table title, row and column headings, units, and footnotes. Locate the relevant values, compare like with like, and identify important patterns. Check whether the data source and time period affect the conclusion.
Why are charts and graphs important in education?
They help students understand numerical information, recognize relationships, compare results, and communicate findings. They are particularly useful when a large amount of information would be difficult to explain through text alone.
How can I improve my graph-reading skills?
Practice with different types of visuals, explain patterns aloud, calculate differences and percentages, and answer questions about the data. Review any mistakes by checking labels, scales, units, and the wording of the question.
How can I tell whether a graph is misleading?
Look for truncated axes, inconsistent intervals, missing labels, selective data, unclear sources, and conclusions that go beyond the evidence. Compare the actual values rather than relying only on the visual impression.
Conclusion
Learning how to interpret charts and graphs helps you become a more confident and independent student. By understanding titles, labels, scales, units, trends, and numerical comparisons, you can extract important information from textbooks without jumping to unsupported conclusions.
The most effective approach is simple: identify what the visual represents, examine the data carefully, recognize the main pattern, and explain your findings with evidence. Apply this process consistently when studying, completing assignments, and preparing for exams.
With regular practice, charts, graphs, and tables become more than collections of numbers. They become useful tools for understanding concepts, evaluating evidence, and making informed academic decisions.
Suggested further reading: The Open University’s free learning resources on provide additional explanations and examples for students.
Understanding a complex subject can be challenging when a chapter contains dozens of unfamiliar terms, theories, processes, and related ideas. Reading the same notes repeatedly may help you recognize the information, but it does not always help you understand how the concepts fit together. A concept map offers a practical way to organize knowledge, identify connections, and see the bigger picture.
Learning how to create a concept map for studying can help you break complicated topics into manageable parts, connect new information with what you already know, and prepare more effectively for exams. Whether you are studying biology, mathematics, history, economics, psychology, or another subject, concept mapping can turn scattered notes into a structured visual representation of your knowledge.
In this guide, you will learn what a concept map is, how to create one step by step, which tools you can use, and how to use your finished map to improve understanding and revision.
What Is a Concept Map?
A concept map is a visual diagram that organizes important ideas and shows the relationships between them. It usually consists of concepts written inside boxes, circles, or other shapes, connected by lines or arrows. Short linking phrases explain how the concepts relate to one another.
Unlike a simple list of facts, a concept map shows how information fits together. It can illustrate relationships such as cause and effect, categories and examples, processes and outcomes, or similarities between different theories.
For example, a concept map about photosynthesis might connect sunlight, chlorophyll, carbon dioxide, water, glucose, and oxygen. The connections explain how these components relate to the process rather than presenting them as unrelated vocabulary words.
A useful concept map typically contains three elements:
Concepts: The main ideas, terms, events, or processes you need to understand.
Connections: Lines or arrows showing relationships between concepts.
Linking phrases: Words that explain the relationship, such as “produces,” “depends on,” “includes,” or “leads to.”
Together, these elements help turn individual facts into a connected explanation.
Why Should Students Use Concept Maps for Studying?
Concept maps can be useful when a subject contains many related ideas or when understanding relationships is more important than memorizing isolated facts.
1. Break Complex Topics Into Smaller Parts
A large topic can feel overwhelming when all its information appears in long paragraphs or extensive notes. A concept map divides the subject into major themes and smaller supporting concepts.
For example, a chapter on the human nervous system could be organized into the central nervous system, peripheral nervous system, neurons, signals, and responses. Each branch can then contain more specific information.
2. Make Relationships Easier to Understand
Some subjects depend on understanding how one idea influences another. Concept maps can make these connections visible.
In economics, for instance, a map might connect supply, demand, prices, production costs, and consumer behavior. The connecting phrases help explain the relationships instead of simply listing economic terms.
3. Identify Gaps in Your Knowledge
Creating a map forces you to decide how ideas fit together. If you cannot explain the connection between two concepts, you may need to review the material.
This makes concept mapping useful for identifying misunderstandings before an examination.
4. Support Active Learning
Building a concept map requires you to select important information, organize it, and explain relationships. You are actively working with the material rather than simply copying it.
You can make the process more effective by creating a first draft from memory and then checking it against your notes or textbook.
5. Help With Exam Preparation
A well-organized concept map can provide a concise overview of a chapter or unit. It can help you review major ideas, explain processes aloud, and practice answering questions about relationships between concepts.
However, a concept map should support other study methods rather than replace practice questions, problem-solving, or detailed reading when those activities are needed.
Concept Map vs Mind Map: What Is the Difference?
Concept maps and mind maps are related visual learning tools, but they are not exactly the same.
Feature
Concept Map
Mind Map
Main purpose
Explain relationships between concepts
Brainstorm and organize ideas around a central topic
Structure
Often hierarchical, with cross-connections
Usually radiates outward from a central idea
Connections
Often labeled with linking phrases
Commonly shown through branches and keywords
Organization
Emphasizes how concepts relate logically
Emphasizes associations and subtopics
Best used for
Understanding systems, theories, and complex relationships
Generating ideas, planning, and organizing initial thoughts
For example, a mind map about environmental science might have branches for pollution, climate, ecosystems, and conservation.
A concept map would go further by showing relationships such as how greenhouse gas emissions contribute to climate change, how climate change affects ecosystems, and how conservation measures may reduce particular environmental pressures.
Neither tool is universally better. Choose the format that fits your learning goal. You can also brainstorm with a mind map first and convert it into a concept map once you understand the relationships more clearly.
How to Create a Concept Map for Studying: Step-by-Step Guide
You do not need expensive software or advanced design skills to make a useful concept map. Paper, a pencil, and your course notes are enough to get started.
Step 1: Choose a Specific Topic
Begin by deciding what you want your concept map to explain. Avoid starting with an entire subject if it contains too much information.
Instead of mapping all of biology, choose a focused topic such as cellular respiration, genetics, the immune system, or photosynthesis.
A useful topic should be broad enough to contain several connected concepts but narrow enough to organize on one page or screen.
Ask yourself:
What chapter or topic am I trying to understand?
What should I be able to explain after studying it?
Which ideas are most important for my course or examination?
You can turn your goal into a focus question. For example, “How does cellular respiration release usable energy from glucose?” gives your map a clear purpose.
Step 2: Brainstorm the Main Concepts
Before drawing the map, create a list of the important concepts associated with your topic.
Review your textbook headings, lecture notes, assigned readings, diagrams, and learning objectives. Write down key terms, processes, causes, outcomes, and examples.
If you are studying photosynthesis, your list might include:
Sunlight
Chlorophyll
Chloroplasts
Carbon dioxide
Water
Light-dependent reactions
Calvin cycle
Glucose
Oxygen
At this stage, focus on collecting relevant ideas rather than making the diagram look attractive.
You can also begin by writing everything you remember without looking at your notes. Afterward, check your materials to identify missing concepts and correct any misunderstandings.
Step 3: Identify the Main Concept
Choose the central idea that best represents the topic. This concept will anchor the rest of the map.
Depending on your preferred layout, place it at the top, in the center, or on the left side of the page.
For example, if you are mapping photosynthesis, place Photosynthesis in a prominent box or circle.
If your focus question concerns a process, you may want to organize the map in a sequence. If the topic involves categories, a hierarchy may be more suitable.
There is no single layout that works for every subject. The best arrangement is the one that makes the relationships easiest to understand.
Step 4: Group Related Concepts Into Categories
Next, organize the remaining terms into groups. This step helps you identify major branches and prevents the map from becoming a random collection of boxes.
Main stages: light-dependent reactions and the Calvin cycle.
Products and outcomes: oxygen and sugar production.
Location: chloroplast structures involved in the process.
These groups provide a starting framework. Check your course material to make sure the categories and relationships are scientifically accurate.
For a history topic, your categories might include causes, major events, important people, consequences, and long-term changes. For mathematics, they might include definitions, formulas, conditions, procedures, and examples.
Step 5: Arrange Concepts From General to Specific
Place the broadest concepts near the main topic and arrange more detailed ideas beneath or beside them.
A hierarchical structure makes it easier to move from an overview to specific details.
For example:
Cell Biology
Cell structure
Cell membrane
Cytoplasm
Nucleus
Cell functions
Energy production
Protein synthesis
Cell division
Mitosis
Meiosis
This hierarchy organizes the subject into meaningful levels. However, concepts do not always fit neatly into one branch. If two branches are connected, you can add a cross-connection rather than forcing the ideas into separate categories.
Step 6: Draw Lines or Arrows Between Related Concepts
Connect concepts that have a meaningful relationship. Use arrows when the direction of the relationship matters, such as in a process or cause-and-effect sequence.
The important point is that every connection should communicate something specific.
For example:
Sunlight → provides energy for → photosynthesis
Chlorophyll → absorbs → light energy
Photosynthesis → produces → sugars
Photosynthesis → releases → oxygen
These examples are simplified descriptions for learning purposes. Your map can include more detailed pathways when required by your course.
If a line connects two concepts but you cannot explain why the connection exists, review the material before keeping it.
Step 7: Add Linking Words to Explain Relationships
Linking phrases are one of the most important features of a concept map. They transform a collection of connected terms into meaningful statements.
Useful linking phrases include:
consists of
depends on
causes
contributes to
includes
produces
is regulated by
differs from
is an example of
influences
requires
Consider the difference between these two connections:
“Photosynthesis — glucose”
“Photosynthesis — produces — glucose”
The second connection explains the relationship more clearly.
Try to make each connected sequence readable as a short sentence. This helps you check whether the map communicates an accurate idea.
Step 8: Add Cross-Connections Between Branches
A strong concept map can show relationships between ideas that appear in different branches.
For example, in a map about ecosystems, one branch might describe producers and consumers, while another explains energy flow. A cross-connection can show how producers introduce energy into food webs and how consumers obtain energy by feeding on other organisms.
Cross-connections are particularly useful for complex subjects because they reveal relationships that a simple outline might hide.
Do not add connections merely to make the diagram look complicated. Each cross-connection should represent a meaningful relationship that you can explain.
Step 9: Include Examples, Evidence, or Key Details
Add supporting information where it helps you understand the concepts. Depending on the subject, this might include examples, short definitions, equations, dates, experimental results, or exceptions to a rule.
For mathematics, you might include a worked example beside a formula. In history, you could add a date or event that illustrates a broader concept. In psychology, you might include an example of a theory applied to everyday behavior.
Keep these details brief. If the map becomes too crowded, create a separate map for a subtopic or move supporting explanations into accompanying notes.
Step 10: Review and Improve the Map
Your first concept map is a draft. Review it against your textbook, lecture notes, or other reliable learning materials.
Check the following:
Is the main concept clearly defined?
Are the most important ideas included?
Are concepts grouped logically?
Do the linking phrases accurately describe the relationships?
Are the arrows pointing in the correct direction?
Have you missed useful cross-connections?
Are any ideas repeated unnecessarily?
Is the diagram easy to read?
Correct factual errors and simplify confusing connections. If necessary, rearrange the concepts and create a second version.
The goal is not to produce a perfect-looking diagram on the first attempt. The goal is to create a map that accurately represents your understanding and helps you improve it.
Example of a Concept Map for a Complex Subject
Consider a student who wants to understand the relationship between the main ideas involved in photosynthesis.
A simplified concept map could be represented as follows:
<box border radius=”xl” padding={3} gap={2} align=”center”> <box background=”#E4F2E8″ theme=”light” radius=”lg” padding={3} width=”80%” align=”center”> <text weight=”medium” textAlign=”center”>Photosynthesis</text> </box> <text color=”secondary” size=”sm”>uses light energy to support</text> <row align=”center” gap={2} width=”100%”> <box background=”#E8F0FC” theme=”light” radius=”lg” padding={3} flex=”1″ align=”center”> <text weight=”medium” textAlign=”center”>Light-dependent reactions</text> </box> <box background=”#E8F0FC” theme=”light” radius=”lg” padding={3} flex=”1″ align=”center”> <text weight=”medium” textAlign=”center”>Calvin cycle</text> </box> </row> <row width=”100%” gap={2}> <box flex=”1″ align=”center” gap={1}> <text color=”secondary” size=”sm” textAlign=”center”>capture energy and form</text> <box border radius=”md” padding={2} width=”100%” align=”center”> <text textAlign=”center”>ATP and NADPH</text> </box> <text color=”secondary” size=”sm” textAlign=”center”>also releases oxygen</text> </box> <box flex=”1″ align=”center” gap={1}> <text color=”secondary” size=”sm” textAlign=”center”>uses carbon dioxide and energy carriers to support</text> <box border radius=”md” padding={2} width=”100%” align=”center”> <text textAlign=”center”>Sugar formation</text> </box> </box> </row> <text color=”secondary” size=”xs”>Simplified study example; the Calvin cycle produces G3P, which can be used to build glucose and other carbohydrates.</text> </box>
This example organizes the topic into a main process, two major stages, and their key functions. A more advanced biology map could include the thylakoid membrane, stroma, electron transport chain, carbon fixation, and the role of enzymes.
The appropriate level of detail depends on what your course expects you to understand.
How to Create Concept Maps for Different Subjects
Concept mapping can be adapted to different academic disciplines. The structure should reflect the kind of relationships that matter in the subject.
Biology and Other Sciences
Use concept maps to connect structures, functions, processes, causes, and outcomes.
For example, a map about the human circulatory system might link the heart, blood vessels, blood, oxygen transport, and body tissues. Arrows can show the direction of blood flow, while linking phrases explain the functions of each component.
For chemistry, a map might connect atomic structure, chemical bonding, molecular properties, and reaction behavior.
Mathematics
Mathematics concept maps can show how definitions, formulas, rules, and problem-solving methods relate.
A map about quadratic equations might connect the standard form, factorization, completing the square, the quadratic formula, and the discriminant.
Add a short worked example where necessary, and clearly state the conditions under which a formula or method applies.
History and Social Studies
History concept maps can organize causes, events, people, decisions, and consequences.
For example, a map about an important historical revolution could connect economic pressures, political conditions, social movements, key events, and long-term outcomes.
Use dates and specific examples to maintain historical accuracy. Avoid simplifying complex events into a single cause when several factors contributed.
Literature and Language
A literature concept map can connect characters, themes, conflicts, symbols, narrative structure, and historical context.
For language learning, you could link a word to its definition, synonyms, antonyms, common collocations, and example sentences.
These connections can help you understand how vocabulary functions in context rather than memorizing isolated definitions.
Economics and Business
Concept maps can show how variables and decisions influence one another.
For example, a map about supply and demand could connect consumer preferences, production costs, market prices, quantity supplied, and quantity demanded.
Use directional labels carefully, since relationships may depend on other conditions. A map should clarify the model you are studying rather than imply that every economic outcome has a single cause.
Should You Use Paper or Digital Tools?
You can create a concept map by hand or use digital tools. Both options can work well, and the right choice depends on your preferences and the complexity of the subject.
Creating a Concept Map on Paper
Paper is useful for brainstorming because you can quickly sketch ideas, move between concepts, and experiment with different layouts.
Advantages include:
No software or internet connection is required.
You can begin immediately.
Drawing can be flexible and inexpensive.
Paper maps are convenient for handwritten study notes.
The main limitation is that a large map can become difficult to rearrange. If the subject changes substantially, you may need to redraw part of the diagram.
Creating a Digital Concept Map
Digital mapping tools allow you to move concepts, edit labels, add links, and expand complex diagrams. Depending on the tool, you may also be able to collaborate with classmates or share your map with an instructor.
XMind for mind maps and related visual organization.
Check each tool’s current features, pricing, and privacy settings before choosing one. You do not need specialized software to create a useful map; a basic drawing application or presentation tool may be enough.
How to Use a Concept Map to Study for Exams
Creating a concept map is only part of the process. To use it effectively, turn the finished diagram into a tool for recalling and explaining information.
1. Recreate the Map From Memory
After studying the original, close your notes and draw a new version from memory.
Include the main concepts, supporting details, and linking phrases. Compare the new map with the original to identify missing ideas and incorrect relationships.
This makes the map a retrieval-practice activity rather than just a reference sheet.
2. Explain the Connections Out Loud
Choose a branch and explain how each concept connects to the next. Try to describe the relationships without reading the labels directly.
If you cannot explain a connection, mark it for review and return to your course materials.
3. Turn Connections Into Questions
Convert the map’s relationships into questions.
For example:
What role does chlorophyll play in photosynthesis?
How do the products of light-dependent reactions support the Calvin cycle?
Why is carbon dioxide needed for sugar production?
Answer these questions without looking at the map. This helps you test whether you understand the subject.
4. Use the Map Alongside Practice Problems
A concept map can show which formulas or ideas connect, but it cannot replace applying them.
In mathematics, solve problems using the relationships in your map. In biology, explain a process from beginning to end. In history, write a short explanation of how several causes contributed to an event.
5. Review the Map Over Time
Return to the map across multiple study sessions instead of reviewing it only once before the examination.
Try to reconstruct important sections from memory, answer questions, and revise any relationships you have misunderstood.
A concept map can become less useful if it contains too much information or fails to explain the relationships between ideas.
Mistake 1: Copying Entire Paragraphs Into Boxes
Long explanations make the diagram difficult to scan and can hide the most important concepts.
Use concise labels and linking phrases. Keep detailed explanations in your notes or a separate reference document.
Mistake 2: Listing Ideas Without Showing Their Relationships
A collection of boxes connected by unlabeled lines may look organized but still leave the relationships unclear.
Add linking phrases that explain what each connection means.
Mistake 3: Including Too Many Details
Trying to include every fact from a chapter can create a crowded map.
Start with the main ideas and add details that help explain the structure. If necessary, create separate maps for related subtopics.
Mistake 4: Using Colors Without a Clear Purpose
Colors can help distinguish categories, but too many colors can make the diagram distracting.
Use a small, consistent color scheme to group related concepts or distinguish different types of information.
Mistake 5: Assuming That a Beautiful Map Means You Understand the Topic
A polished diagram does not guarantee accurate understanding.
Check the map against reliable course materials and test yourself by explaining or recreating it without looking.
Mistake 6: Never Revising the First Draft
Your understanding may change as you learn more. Update the map when you discover missing relationships, correct an error, or develop a clearer explanation.
Revision is part of the learning process, not a sign that the first attempt failed.
A Quick Checklist for Creating an Effective Concept Map
Before using your map for revision, check that it meets these criteria:
The topic or focus question is clearly defined.
The main concept is easy to identify.
Major ideas are grouped logically.
More specific details support the broader concepts.
Lines and arrows show meaningful relationships.
Linking phrases explain what each connection means.
Important cross-connections are included.
Examples or formulas are added where useful.
The map is readable and not overcrowded.
The information has been checked against reliable course materials.
I can explain the main relationships without looking at my notes.
If several items are missing, revise the map before relying on it as your main study resource.
Frequently Asked Questions
What is the easiest way to create a concept map?
Start with a focused topic, list the key concepts, and place the main idea at the top or center of the page. Group related concepts, connect them with lines or arrows, and add short phrases that explain the relationships. Review and revise the map using your course materials.
What is the difference between a concept map and a mind map?
A concept map emphasizes explicit relationships between ideas, often using linking phrases and cross-connections. A mind map typically begins with a central topic and branches into related ideas. Both can be useful, but concept maps are particularly suitable when you need to explain how concepts connect.
How many concepts should a concept map include?
There is no fixed number. Include enough concepts to explain the topic’s important relationships without making the map difficult to read. A short revision map may contain a handful of major concepts, while a complex subject may need several connected maps.
Are concept maps useful for exam preparation?
Yes. Concept maps can help you organize information, recognize relationships, and identify gaps in understanding. They are especially useful when combined with retrieval practice, self-testing, and subject-specific exercises.
Can I create a concept map digitally?
Yes. You can use dedicated concept-mapping software, diagramming applications, presentation tools, or a digital whiteboard. Paper works equally well for many topics, so choose the format that makes it easiest for you to organize and revise ideas.
How is a concept map different from an outline?
An outline organizes information in a hierarchical list, usually with headings and subheadings. A concept map uses visual connections to show relationships between concepts, including connections across different branches. An outline may be easier for planning a written assignment, while a concept map can be more useful for exploring relationships.
Should I create a concept map before or after reading a chapter?
You can do both. Start with a rough map from memory before reading to identify what you already know and what you need to learn. Then revise it after reading and reviewing your notes. Comparing the two versions can help you identify how your understanding has developed.
Can concept maps help with research projects?
Yes. A concept map can help you organize a research topic, connect major themes, identify relationships between variables, and develop possible research questions. It can also help you organize evidence before writing a literature review.
Conclusion
Learning how to create a concept map for studying can make complex subjects easier to organize, understand, and review. By identifying the main concept, grouping related ideas, labeling connections, and adding meaningful cross-links, you can turn scattered information into a clearer picture of how a topic works.
The most useful concept map is not necessarily the most colorful or detailed. It is the one that accurately represents the subject and helps you explain the relationships between its key ideas.
Start with one chapter or difficult topic, build a simple first draft, and improve it as you learn. Then use the map to recall information, answer questions, and practice explaining concepts without looking at your notes. With regular practice, concept mapping can become a practical part of your study routine.